
 By
By Reviewed by
About 1 in 31 children aged eight were identified with autism in the CDC’s 2022 surveillance communities, according to its report published April 17, 2025. Autism statistics describe people with a wide range of communication styles, abilities and support needs. A prevalence estimate helps communities plan schools, health care and adult services, but cannot describe a particular person’s life. This page was updated September 16, 2026; the latest CDC surveillance findings still describe children in 2022.
Last full review: September 16, 2026 · sourced from CDC surveillance, WHO, the National Survey of Children’s Health, Drexel University and peer-reviewed research.
Ten numbers that define autism in 2026
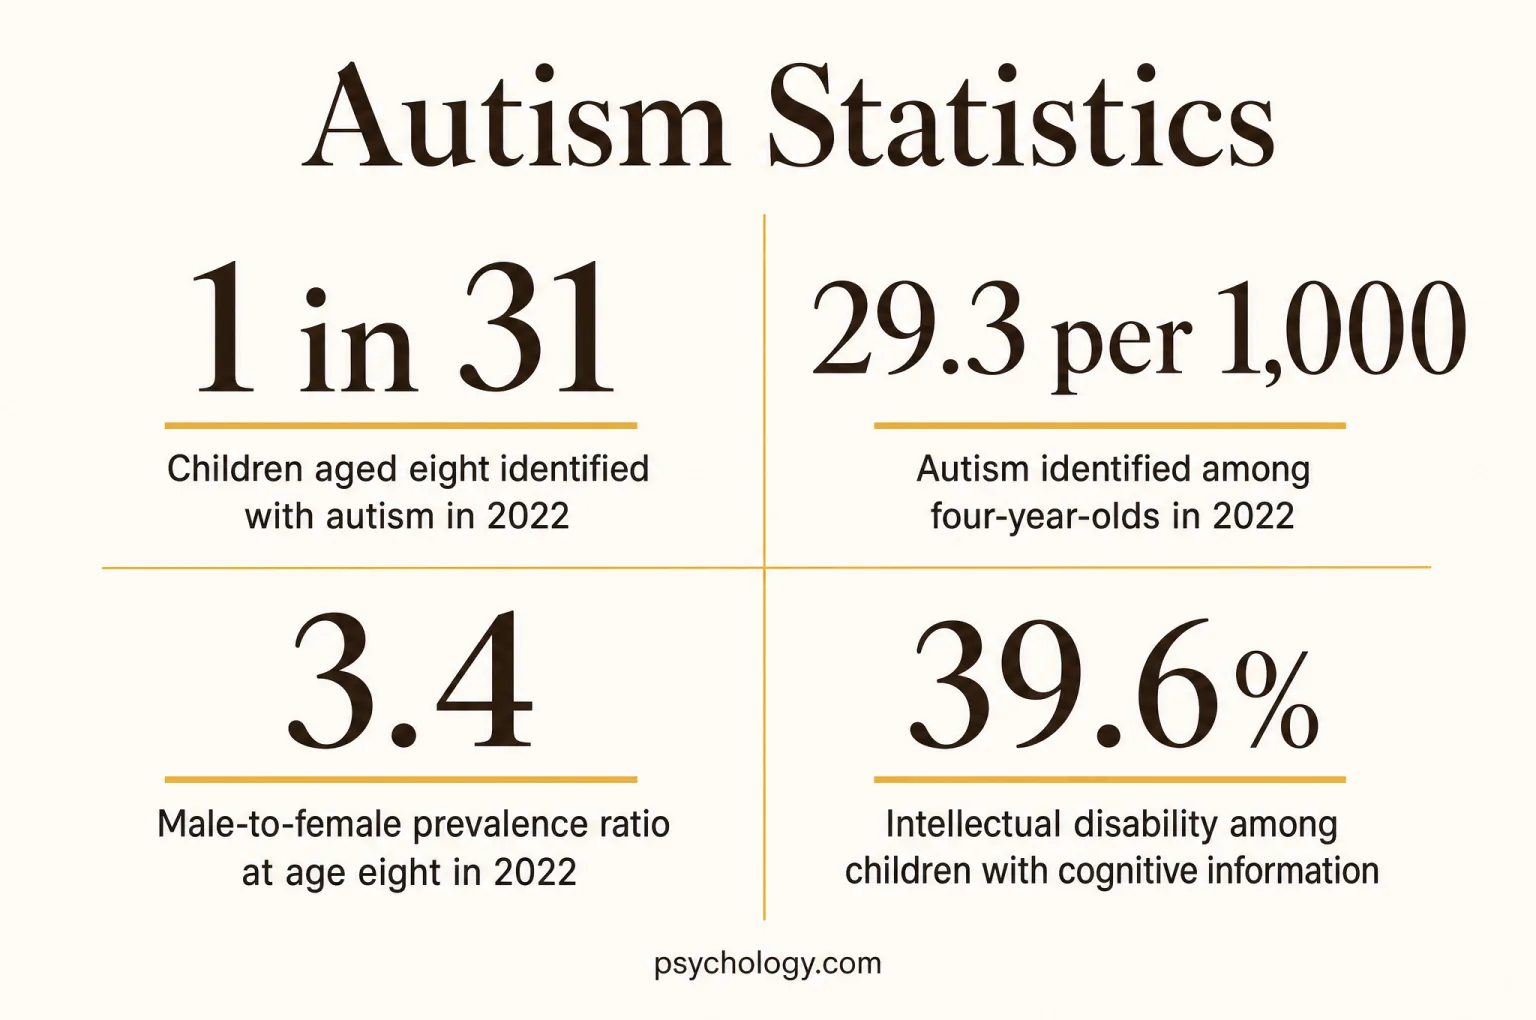
- 1 in 31 children aged eight were identified with autism across the CDC’s 2022 surveillance communities, a local surveillance estimate used for service planning. Shaw et al., CDC ADDM surveillance, 2025
- 29.3 per 1,000 four-year-olds were identified with autism in the CDC’s 2022 ADDM surveillance network, showing substantial identification before school age. Shaw et al., CDC ADDM surveillance, 2025
- Dietz and colleagues’ CDC-led model estimated U.S. autism prevalence at 2.21% among adults aged 18 to 84 in 2017, including diagnosed and undiagnosed adults. Dietz et al., National and State Estimates, 2020
- 1 in 127 people globally were estimated to be autistic in 2021, according to WHO’s all-age estimate. WHO, Autism fact sheet, 2025
- Recorded prevalence among boys was 3.4 times that among girls at age eight in the CDC’s 2022 surveillance. Shaw et al., CDC ADDM surveillance, 2025
- In the CDC’s 2022 ADDM surveillance, 39.6% of autistic eight-year-olds with cognitive information had intellectual disability, with missing cognitive records limiting generalization. Shaw et al., CDC ADDM surveillance, 2025
- 47 months was the median earliest diagnosis age among eight-year-olds with an evaluation containing an autism diagnostic statement in the CDC’s 2022 surveillance. Shaw et al., CDC ADDM surveillance, 2025
- Children born in 2018 had 1.7 times the cumulative incidence of autism diagnosis or autism special education eligibility by 48 months as children born in 2014, in the CDC’s 2022 surveillance. Shaw et al., CDC ADDM surveillance, 2025
- Drexel University’s 2015 report found that 58% of autistic young adults in a U.S. special education cohort followed from 2001 to 2009 had ever worked for pay outside the home after high school. Roux et al., Drexel National Autism Indicators Report, 2015
- NHS England reported 294,792 patients with an open referral for suspected autism in June 2026, with a missing provider submission affecting the total. NHS England, Autism Statistics, July 2025 to June 2026
How common autism is
The familiar CDC headline concerns children of a particular age living in selected communities. Adult estimates and worldwide figures answer broader questions using different methods. Parent surveys add another view of identified autism. Their denominators matter as much as their percentages when comparing the size of populations that may need services.
Children aged eight identified with autism in 2022
The CDC’s ADDM Network reported 32.2 per 1,000 children aged eight, summarized as one in 31, across participating communities in 2022. Identification included a documented diagnosis, autism special education eligibility or an autism diagnostic code. The network examines existing records rather than independently assessing every child. Its combined estimate describes the monitored areas, whose access to evaluations and services varies. It therefore provides a strong surveillance benchmark while leaving uncertainty about children missed by local systems and communities outside the network.
- 2.21%Modeled U.S. adult prevalence in 2017
The CDC-led model covered ages 18 to 84 and included estimated undiagnosed adults, making it broader than a count of people with autism recorded in health care.
- 5,437,988Adults represented by the 2017 U.S. model
This modeled population count gives a scale for adult services; it is a historical estimate, with uncertainty, rather than a contemporary census of diagnosed people.
- 4.3%Current autism reported by parents, 2023 to 2024
The NSCH household survey covered ages three to 17 nationally, a wider age range and different method from ADDM’s review of eight-year-olds’ records.
- 1 in 127WHO’s global all-age estimate for 2021
The worldwide estimate includes children and adults across settings with very different diagnostic resources, so its direct comparison with U.S. childhood surveillance would mix populations.
- 100/10,000Median prevalence in the global review searched in 2021
Zeidan and colleagues’ 2022 review gives the familiar approximate one-in-100 childhood figure; a median across studies gives each estimate a different role from population-weighted global modeling.
- 33.0%Median intellectual disability share in that global review
The 2022 synthesis, searched through November 2021, describes the composition of studied autism populations and underscores how support needs differ across the samples contributing prevalence estimates.
- 2,661,609Children represented by the 2023 to 2024 NSCH estimate
The weighted national estimate covers parent-reported current autism at ages three to 17; it describes the population represented by survey responses rather than a registry of individual diagnoses.
Why prevalence estimates differ
A household survey depends on families knowing and reporting a diagnosis. Record surveillance depends on accessible clinical and school documentation. A model can estimate people who have never received a diagnosis, although its result then depends on assumptions that a directly observed count does not require. The NSCH asks whether a child currently has autism after asking about a previous professional diagnosis; that question wording should accompany its percentage. A school record may establish autism eligibility without a separate medical diagnostic statement appearing in the records available to surveillance staff. These differences explain why estimates should retain their original names and populations. NSCH indicator definition; ADDM methods.
Autism is a lifelong developmental condition with varied support needs. Psychology.com’s autism resources provide background on the terms used in prevalence and diagnosis research.
Autism in children: the CDC surveillance picture
The 2025 report describes 2022 records for both preschool and school-age children, helping separate early identification from identification later in childhood. Its case definition draws on several kinds of records. The overlap between those records matters: education eligibility, a diagnostic statement and an insurance code can all refer to the same child.
Autism identified among four-year-olds in 2022
Across the surveillance network, prevalence among children aged four was 29.3 per 1,000 in 2022. A preschool estimate reflects what local systems have identified by that age, leaving additional time for recognition later in childhood. Some children will have incomplete evaluations or records that express suspicion without a confirmed identification. Comparing the preschool group with eight-year-olds therefore combines age differences with differences between birth cohorts. The clearest early-identification comparison follows both cohorts up to the same birthday, using documented diagnosis or autism special education eligibility as the outcome.
- 68.4%Cases with a documented diagnostic statement
Among autistic eight-year-olds in the 2022 record-abstraction sites, this share had a diagnostic statement available; the remaining records could qualify through education eligibility or a diagnostic code.
- 67.3%Cases with autism special education eligibility
This 2022 share shows how much educational records contribute to identification; school eligibility is tied to educational support and can coexist with a documented medical diagnosis.
- 68.9%Cases with an autism diagnostic code
Diagnostic codes were common among identified eight-year-olds in 2022, but the code itself carries less narrative detail than a developmental evaluation describing the child’s presentation.
- 9.4%Cases identified through a diagnostic code alone
This smaller 2022 group met the surveillance definition without a diagnostic statement or autism education eligibility in the available records, illustrating why documentation pathways should be distinguished.
- 61.4%Cases with cognitive information available
Cognitive data were available for this share of autistic eight-year-olds in the 2022 abstraction sample, leaving a substantial missing-data group outside the intellectual disability calculation.
- 3.1 per 1,000Additional four-year-olds with suspected autism
The 2022 suspected-autism category required an evaluator’s recorded suspicion without meeting the surveillance case definition, so these children were counted separately from identified autism.
| Measure and population | Figure | Meaning and source |
|---|---|---|
| 2018 birth cohort, diagnosis or autism education eligibility by 48 months | 22.6 per 1,000 | The younger cohort’s cumulative identification rate measures diagnosis or autism education eligibility by the fourth birthday. Shaw et al., CDC ADDM surveillance, 2025 |
| 2014 birth cohort, diagnosis or autism education eligibility by 48 months | 13.1 per 1,000 | The older cohort had less identification by the same age, allowing a comparison across birth cohorts. Shaw et al., CDC ADDM surveillance, 2025 |
| 2018 versus 2014 birth cohort, diagnosis or eligibility by 48 months | 1.7 times | The rate ratio indicates more early identification in the younger cohort; it cannot isolate the cause of that increase. Shaw et al., CDC ADDM surveillance, 2025 |
Records reflect the services children encounter
The CDC review can identify a child through a clinical evaluation, special education or a diagnostic code, depending on what local systems document and make available. Percentages for those routes overlap, so adding them would count many children repeatedly. Missing cognitive information has a different consequence: it changes which children contribute to the intellectual disability estimate. A child without a cognitive score in the surveillance file should remain in the missing-information category. For families and service planners, the practical distinction is between the number of children recognized and the detail available about their individual needs. CDC case definition and record availability, 2022.
Who is diagnosed: sex, race, geography and age
Among children aged eight in the CDC’s 2022 surveillance areas, recorded autism prevalence differs by sex, race and community, while the timing of diagnosis also varies. Those differences describe identification within particular systems. The CDC’s categories follow population and record data; they cannot separate every contribution from access, referral practices, developmental presentation, social conditions or underlying prevalence. Race groups below are non-Hispanic; the Hispanic category includes children of any race.
Male-to-female prevalence ratio at age eight in 2022
The 2022 surveillance rate was 49.2 per 1,000 boys and 14.3 per 1,000 girls. That produces the reported prevalence ratio of 3.4. Recorded sex categories are different from gender identity, and this comparison does not describe every autistic person’s identity. It also cannot measure how many girls remain unrecognized. Differences between studies that screen populations and studies that rely on existing diagnoses offer a separate way to investigate recognition bias.
- 38.2 per 1,000Asian or Pacific Islander children
In 2022, this combined surveillance category had the highest overall recorded prevalence among eight-year-olds; it groups diverse populations and should not be treated as a single cultural experience.
- 37.5 per 1,000American Indian or Alaska Native children
The 2022 point estimate was above the White reference group, although smaller population numbers make detailed comparisons especially sensitive to statistical uncertainty and local sampling.
- 36.6 per 1,000Non-Hispanic Black children
The 2022 identification rate exceeded the White rate, continuing the pattern observed in 2020; this alone does not establish equal access to timely or comprehensive evaluations.
- 33.0 per 1,000Hispanic or Latino children
The 2022 group included children of Hispanic origin regardless of race, which matters when comparing these categories with surveys that classify ethnicity in a different way.
- 27.7 per 1,000Non-Hispanic White children
This was the lowest overall racial or ethnic group estimate in the 2022 surveillance network, a different ordering from the pattern found in earlier ADDM reporting years.
- 31.9 per 1,000Multiracial children
The 2022 category covered children identified as belonging to multiple racial groups; a combined estimate can conceal differences between communities and between the families it includes.
| Measure and population | Figure | Meaning and source |
|---|---|---|
| Texas, Laredo surveillance area: prevalence | 9.7 per 1,000 | This was the lowest site estimate, rather than an estimate for Texas as a whole. Shaw et al., CDC ADDM surveillance, 2025 |
| California surveillance area: prevalence | 53.1 per 1,000 | This was the highest site estimate, rather than a statewide California measurement. Shaw et al., CDC ADDM surveillance, 2025 |
| California surveillance area: median diagnosis age | 36 months | The median refers to the earliest diagnosis documented in available evaluations. Shaw et al., CDC ADDM surveillance, 2025 |
| Texas, Laredo surveillance area: median diagnosis age | 69.5 months | A later median can reflect recognition and access differences as well as the cases recorded. Shaw et al., CDC ADDM surveillance, 2025 |
Recognition of girls depends partly on how researchers look
In Loomes and colleagues’ 2017 meta-analysis, the male-to-female odds ratio was 3.25 in studies that screened populations and 4.56 in studies limited to existing diagnoses. The difference supports concern about under-recognition of girls, although it does not quantify all missed diagnoses. Zeidan’s separate review, searched through November 2021, reported a median sex ratio of 4.2 across its included estimates. Ratios from different designs should remain attached to their methods. Loomes et al., 2017; Zeidan et al., 2022.
The autism in women screening provides a separate self-reflection resource; a questionnaire result does not establish a diagnosis or an individual probability from these population figures.
The communication styles worksheet can provide language for describing interaction preferences; it does not classify autism or explain differences in population prevalence.
Co-occurring conditions and health
Co-occurring conditions affect health and daily life in ways that prevalence alone cannot capture. Intellectual disability, ADHD, anxiety, sleep disorders and epilepsy describe different support needs. Estimates vary with age, study setting and diagnostic method, and an individual can belong to several categories at once.
Intellectual disability among children with cognitive information
In the 2022 CDC age-eight cohort, 39.6% of autistic children with available cognitive information were classified as having intellectual disability. The classification used a qualifying cognitive score or an examiner’s statement. The denominator excludes children without that information, so the percentage should not be applied automatically to all autistic children. It also does not describe an individual’s communication, daily living skills or future. Cognitive classifications are one part of the records used to understand varied support needs.
- 28%Co-occurring ADHD
Lai’s synthesis of studies published from 1993 to February 2019 estimated this pooled prevalence, with substantial differences between samples.
- 20%Co-occurring anxiety disorders
The same 2019 review pooled diagnosed anxiety disorders, which is a narrower outcome than reporting occasional anxiety or stress.
- 13%Co-occurring sleep-wake disorders
The 1993 to 2019 evidence concerns diagnosed disorders; a survey asking about any sleep difficulty can yield a different percentage.
- 11%Co-occurring depressive disorders
The historical pooled estimate from the 2019 review describes study populations spanning different ages and settings.
- 9%Co-occurring obsessive-compulsive disorder
The 2019 review concerns an additional diagnosis; repetitive autistic behavior alone does not establish OCD.
- About 1 in 10Co-occurring epilepsy
Liu’s review of studies published through 2020 summarized epilepsy at approximately one in ten autistic people, with variation across populations.
| Measure and population | Figure | Meaning and source |
|---|---|---|
| Ever attempted elopement after age four, parent survey published in 2012 | 49% | This is an ever-occurrence measure in participating families, rather than a yearly probability for every autistic child. Anderson et al., Occurrence and family impact of elopement, 2012 |
| Missing long enough to cause concern, same 2012 survey | 26% | This is a separate outcome within the full surveyed autism sample, not the share of elopement episodes with injury. Anderson et al., Occurrence and family impact of elopement, 2012 |
| Mortality odds ratio, Swedish cohort diagnosed 1987 to 2009 | 2.56 | The comparison with matched controls measures relative odds during follow-up; it does not express years of life lost. Hirvikoski et al., Premature mortality, 2016 |
| Apparent life expectancy reduction at age 18, diagnosed autistic UK men without recorded intellectual disability | 6.14 years | The estimate uses records from 1989 to 2019 (95% confidence interval: 2.84 to 9.07 years); underdiagnosis limits its applicability to all autistic people. O’Nions et al., Estimating life expectancy, 2024 |
| Apparent life expectancy reduction at age 18, diagnosed autistic UK women without recorded intellectual disability | 6.45 years | The estimate uses records from 1989 to 2019 (95% confidence interval: 1.37 to 11.58 years); underdiagnosis limits its applicability to all autistic people. O’Nions et al., Estimating life expectancy, 2024 |
Life expectancy headlines require particular care
The UK study by O’Nions and colleagues used life tables and explicitly warned that diagnosed adults may have greater support needs and more co-occurring illness than undiagnosed adults. Hirvikoski’s Swedish study addresses premature mortality using a different design. A mean age among people who died during follow-up is different from life expectancy calculated for a population, and neither gives a personal deadline. Health inequalities remain important even when a single dramatic lifespan headline is misleading. O’Nions et al., 2024; Hirvikoski et al., 2016.
Adults, employment and independent living
Adult life extends far beyond diagnosis. Work, education, housing and access to support are separate outcomes, with different definitions in research. Drexel’s influential transition estimates come from a historical cohort of special education students, while CDC’s adult prevalence model estimates a much broader population.
Autistic young adults who had ever worked after high school
Drexel’s 2015 report found that 58% of autistic young adults from a special education cohort had worked for pay outside the home between high school and their early twenties. The underlying NLTS2 cohort was followed from 2001 to 2009. An ever-employed measure includes brief employment and says little about present hours, wages or job stability. It should therefore retain its historical time window whenever used to describe adult opportunities.
- 32%Ever worked among those zero to two years out of high school
In the historical NLTS2 cohort, 32% of respondents surveyed zero to two years after leaving school had ever worked for pay outside the home.
- 36%Attended postsecondary education
Drexel’s 2001 to 2009 measure included college or vocational study; attendance does not establish completion or a qualification.
- 19%Ever lived independently after high school
The historical 2001 to 2009 measure concerns living away from parents without supervision, rather than every form of supported housing.
- 87%Lived with parents at some point
This 2001 to 2009 measure can overlap with periods of independent living, so the two categories are not opposites.
- 37%Neither work nor further education after school
In this historical special education cohort, 37% had never worked for pay or attended postsecondary education after high school; this differs from unemployment, which depends on job seeking.
- 450%Growth in recorded diagnosis at ages 26 to 34
Across participating U.S. health systems, recorded diagnosis rates rose by this amount from 2011 to 2022, drawing attention to adult service capacity.
Grosvenor et al., Autism Diagnosis Among US Children and Adults, 2024
| Measure and population | Figure | Meaning and source |
|---|---|---|
| Louisiana adult prevalence model, 2017 | 1.97% | The low state estimate in the CDC-led model includes estimated undiagnosed adults. Dietz et al., National and State Estimates, 2020 |
| Massachusetts adult prevalence model, 2017 | 2.42% | The high state estimate is modeled, rather than directly observed in a statewide adult survey. Dietz et al., National and State Estimates, 2020 |
| Modeled U.S. lifetime support cost with intellectual disability (2011 dollars) | $2.4 million | Buescher’s 2014 societal-cost model estimated US $2.4 million in 2011 prices, using evidence searched in October 2013. Buescher et al., Costs of autism spectrum disorders, 2014; Original paper, 2011 cost basis. |
| Modeled U.S. lifetime support cost without intellectual disability (2011 dollars) | $1.4 million | The same model estimated US $1.4 million in 2011 prices, including direct and indirect societal costs. Buescher et al., Costs of autism spectrum disorders, 2014; Original paper, 2011 cost basis. |
Adult outcomes need current and inclusive measurement
The NLTS2 findings remain useful as a historical benchmark, but their special education sampling frame leaves out autistic people who were never in that system. Contemporary adult planning also needs information about job quality, chosen living arrangements and supports that make participation possible. Cost models answer another question by assigning monetary values to services and productivity losses. Those totals can describe resource needs without measuring a person’s value, contribution or quality of life. Drexel report methods; Buescher et al., 2014.
Adults exploring their own experiences can use the adult autism screening as a reflection resource. The list of strengths offers space to describe abilities and priorities alongside support needs. These resources do not establish a diagnosis or measure how a person compares with an employment cohort.
Trends since 2000
Autism identification has increased across successive CDC surveillance rounds. The series tracks different birth cohorts and sometimes different communities, data sources and case definitions. Its rise signals changing demand for services, while the surveillance design cannot determine how much each possible explanation contributes to the change.
Increase across repeat surveillance sites from 2020 to 2022
Among sites participating in both rounds, age-eight prevalence was 22.2% higher in 2022 than in 2020. This repeat-site comparison is different from comparing the combined headlines from networks with changing membership. The CDC also found an increase when restricting comparison to sites with unchanged boundaries and data sources. That strengthens the evidence of increased identification, while leaving the reasons for the increase open to further study.
- 6.7 per 1,0002000 surveillance: about one in 150
The earliest ADDM benchmark came from a smaller network, so later nationwide interpretations should preserve the surveillance-area qualification.
- 14.6 per 1,0002012 surveillance: about one in 68
The 2012 report used the older behavioral-review case definition, which matters when comparing it with later community-identification measures.
- 16.8 per 1,0002014 surveillance: about one in 59
The 2014 estimate continued the longer-term rise in identified prevalence, but the comparison spans different groups of eight-year-olds.
- 18.5 per 1,0002016 surveillance: about one in 54
This 2016 benchmark preceded adoption of the revised surveillance definition and should remain labeled with its year.
- 23.0 per 1,0002018 surveillance: about one in 44
The 2018 report used recorded community identification, including diagnostic statements, education eligibility and diagnostic codes.
- 27.6 per 1,0002020 surveillance: about one in 36
The 2020 estimate provides the previous reporting-round context for the 2022 headline of one in 31.
Changes also appear in health-system records
Grosvenor and colleagues reported a 175% increase in recorded autism diagnosis rates across their full health-system sample from 2011 to 2022. The increases were 305% among female children and 315% among female adults. These findings concern diagnoses appearing in participating health systems; they do not directly count everyone who meets autism criteria. Awareness, referral, recording and access can change alongside diagnosis rates, making causal claims from the trend alone unwarranted. Grosvenor et al., 2024.
Diagnosis delays and access to services
Families can notice developmental differences well before an autism diagnosis appears in a record. Adults can also spend years without recognition. Age at diagnosis, delay after a first conversation and time waiting for an appointment describe different stages, so they should remain separate measures when assessing access.
Waiting at least 13 weeks for contact in England
NHS England’s June 2026 performance report states that, among people waiting for autism assessment in March 2026, 82.7% were waiting at least 13 weeks for contact. This is an administrative waiting-list measure for England. It is different from the time taken to complete diagnosis and cannot establish a corresponding U.S. wait.
- 47 monthsMedian earliest diagnosis among eight-year-olds with diagnostic evaluations, 2022
Among the 5,887 autistic eight-year-olds with an evaluation containing a diagnostic statement, the median earliest diagnosis was 47 months; this measures documented diagnosis timing.
- 50.3%Evaluated by three years in the 2022 CDC cohort
The measure includes autistic eight-year-olds with available developmental evaluations and concerns evaluation timing, rather than completion of an autism diagnosis.
- 2.1 yearsFirst provider conversation in the 2011 Pathways survey
Parents of autistic children aged six to 11 with special health care needs recalled their first provider conversation about developmental concerns at this mean age in the 2011 survey.
- 4.4 yearsMean diagnosis age in the 2011 Pathways survey
The 2011 parent-reported analysis of autistic children aged six to 11 with special health care needs found this mean diagnosis age, a different measure and population from the CDC median.
- 2.2 yearsMean diagnostic delay in the 2011 Pathways survey
For the same 2011 sample of autistic children aged six to 11, this mean interval ran from the first provider conversation to diagnosis; it does not measure a formal waiting list.
- 26%No surveyed services in the historical transition cohort
In Drexel’s historical NLTS2 special education cohort, 26% of autistic young adults received none of the surveyed services in their early twenties; receipt alone does not measure unmet need.
- 294,792Open suspected-autism referrals in England in June 2026
NHS England’s release published August 13, 2026 counts patients with an open referral; a missing submission from the Owl Centre affected the total, so a lower count cannot establish improved access.
- 86.8%Open referrals at least 13 weeks old in June 2026
This NHS England measure describes the age of an open referral, which differs from waiting without a first care contact or waiting for a completed diagnosis; community pediatric assessment activity is excluded.
| Measure and population | Figure | Meaning and source |
|---|---|---|
| ESDM group: 2010 trial of autistic toddlers aged 18 to 30 months at enrollment, two-year IQ score gain | 17.6 points | The 48-child trial measured mean change from baseline in IQ standard-score points. Dawson et al., Randomized controlled ESDM trial, 2010 |
| Community-intervention group: same 2010 toddler trial, two-year IQ score gain | 7.0 points | The comparison group also improved, so the ESDM group’s gain cannot all be attributed to the intervention. Dawson et al., Randomized controlled ESDM trial, 2010 |
| European trial recruited in 2015 to 2019: autistic children aged 19 to 36 months at enrollment, 24-month developmental quotient difference | 3.82 points | ESDM plus usual care versus usual care alone: the difference was not statistically significant (95% confidence interval: -1.25 to 8.89 points). Geoffray et al., ESDM effectiveness trial, 2025 |
Earlier diagnosis and intervention outcomes are separate questions
Among eight-year-olds with an evaluation documenting an autism diagnosis in the CDC’s 2022 surveillance, median diagnosis age was 43 months with intellectual disability and 49 months without it. Earlier recognition in a group does not by itself establish better later outcomes. Trials investigate intervention effects using specific participants, comparison services and outcomes. The 2025 European ESDM trial’s nonsignificant primary result is important context alongside the earlier positive trial. Neither result supplies a universal outcome forecast. CDC, 2022 data; Geoffray et al., 2025.
The child autism screening is a separate reflection resource; it does not replace a developmental assessment or measure eligibility for services.
People seeking support with anxiety, relationships or life changes can explore a licensed therapist through Psychology.com. Assessment pathways and eligibility for developmental services depend on the provider and local system, while the waiting-time statistics above describe particular administrative records.
Common questions
How common is autism in 2026?
The latest CDC surveillance report available for this review describes 2022: about one in 31 eight-year-olds across participating communities were identified with autism. It is not a survey of every U.S. child in 2026. WHO’s global all-age estimate is one in 127 for 2021, while the 2023 to 2024 NSCH estimates parent-reported current autism at 4.3% among U.S. children aged three to 17. CDC report; WHO; NSCH.
Why have autism statistics increased since 2000?
Recorded identification has risen across CDC surveillance rounds, alongside changes in recognition, diagnostic definitions, record access and community services. Different cohorts also have different opportunities to be evaluated. These data cannot assign a percentage of the increase to each explanation or prove a single cause. The repeat-site comparison still found higher prevalence between 2020 and 2022, supporting increased identification even within a more comparable set of communities. CDC interpretation.
Is autism less common in girls and women?
Recorded childhood prevalence is lower among girls, but existing diagnoses do not capture every person who meets criteria. In 2022, the CDC’s male-to-female prevalence ratio was 3.4 at age eight. A 2017 meta-analysis found a lower male-to-female odds ratio in population-screening studies than in studies restricted to existing diagnoses, supporting concern about missed recognition. Neither finding establishes the proportion of autistic women who remain undiagnosed today. CDC; Loomes et al..
How many adults are autistic?
A CDC-led model estimated 5,437,988 U.S. adults, or 2.21%, for 2017. It modeled ages 18 to 84 and included estimated diagnosed and undiagnosed people. That is different from counting adults with a diagnosis documented in medical records. Later health-system research found especially rapid growth in recorded diagnosis among young adults, but that trend does not update the national model or measure everyone who remains unrecognized. Dietz et al.; Grosvenor et al..
What do employment statistics say about autistic adults?
Drexel’s often-cited 58% figure means ever working for pay after high school in a cohort followed from 2001 to 2009. It is not a current employment rate for all autistic adults. The research started with special education students and followed them into young adulthood, leaving many later-diagnosed adults outside its sampling frame. Employment duration, wages, accommodations and a person’s preferred working arrangements require additional measures. Drexel report.
What do health and mortality statistics mean for an autistic person?
Population studies find important health inequalities, but cannot predict a person’s lifespan. Co-occurring conditions, support needs and access to care differ widely, and diagnosed adults may be unrepresentative of all autistic adults. The UK life expectancy study explicitly discusses that limitation. Statistics about mortality can be distressing, and support is available. In the United States, anyone experiencing a suicidal crisis can call or text 988. O’Nions et al..
How we compiled this
Figures were checked against the linked surveillance reports, survey tables, research articles and abstracts. CDC estimates refer to participating surveillance areas; household surveys and adult models use different populations and methods. Data years are retained, including historical studies of transition, costs and diagnostic delays. Percentages, rates, ratios and score changes remain separate measures. Published uncertainty and missing information are described where they materially affect interpretation. The latest CDC report is cited at its publisher URL, with public repositories retained for other original research reports. The collection includes repeated headline figures for navigation, alongside distinct estimates in tables and explanatory text. It is a research summary for public understanding and service planning. The September 16, 2026 freshness check includes the 2023 to 2024 NSCH release and NHS England’s August 13, 2026 publication; referral duration and time without contact remain separate outcomes. Last full review: September 16, 2026.
Journalists and researchers may reuse any statistic with attribution to the original source and a link to Psychology.com.
Cite this source
Fontane Pennock, S. (2026, September 13). Autism Statistics 2026. Psychology.com. https://psychology.com/autism-statistics/
References
- Shaw, K. A., et al. (2025). Prevalence and early identification of autism spectrum disorder among children aged 4 and 8 years: ADDM Network, 16 sites, United States, 2022. MMWR Surveillance Summaries, 74(2), 1-22. Original source
- Dietz, P. M., Rose, C. E., McArthur, D., & Maenner, M. (2020). National and state estimates of adults with autism spectrum disorder. Journal of Autism and Developmental Disorders, 50, 4258-4266. Original source
- World Health Organization. (2025). Autism. Fact sheet updated September 17, 2025. Original source
- Zeidan, J., et al. (2022). Global prevalence of autism: A systematic review update. Autism Research, 15(5), 778-790. Original source
- Child and Adolescent Health Measurement Initiative. (n.d.). 2023 to 2024 National Survey of Children’s Health: Indicator 2.8, current autism, ages 3 to 17. Data Resource Center for Child and Adolescent Health. Original source
- Loomes, R., Hull, L., & Mandy, W. P. L. (2017). What is the male-to-female ratio in autism spectrum disorder? A systematic review and meta-analysis. Journal of the American Academy of Child & Adolescent Psychiatry, 56(6), 466-474. Original source
- Lai, M.-C., et al. (2019). Prevalence of co-occurring mental health diagnoses in the autism population: A systematic review and meta-analysis. The Lancet Psychiatry, 6(10), 819-829. Original source
- Liu, X., et al. (2022). Prevalence of epilepsy in autism spectrum disorders: A systematic review and meta-analysis. Autism, 26(1), 33-50. Original source
- Anderson, C., et al. (2012). Occurrence and family impact of elopement in children with autism spectrum disorders. Pediatrics, 130(5), 870-877. Original source
- Hirvikoski, T., et al. (2016). Premature mortality in autism spectrum disorder. The British Journal of Psychiatry, 208(3), 232-238. Original source
- O’Nions, E., et al. (2024). Estimating life expectancy and years of life lost for autistic people in the UK: A matched cohort study. The Lancet Regional Health: Europe. Original source
- Buescher, A. V. S., Cidav, Z., Knapp, M., & Mandell, D. S. (2014). Costs of autism spectrum disorders in the United Kingdom and the United States. JAMA Pediatrics, 168(8), 721-728. Original source Original paper, 2011 cost basis.
- Roux, A. M., Shattuck, P. T., Rast, J. E., Rava, J. A., & Anderson, K. A. (2015). National Autism Indicators Report: Transition into young adulthood. A. J. Drexel Autism Institute, Drexel University. Original report hosted by Drexel University. Original source
- Grosvenor, L. P., et al. (2024). Autism diagnosis among US children and adults, 2011-2022. JAMA Network Open, 7(10), e2442218. Original source
- Christensen, D. L., et al. (2016). Prevalence and characteristics of autism spectrum disorder among children aged 8 years: ADDM Network, 11 sites, United States, 2012. MMWR Surveillance Summaries, 65(3), 1-23. Original source
- Maenner, M. J., et al. (2020). Prevalence of autism spectrum disorder among children aged 8 years: ADDM Network, 11 sites, United States, 2016. MMWR Surveillance Summaries, 69(4), 1-12. Original source
- Maenner, M. J., et al. (2021). Prevalence and characteristics of autism spectrum disorder among children aged 8 years: ADDM Network, 11 sites, United States, 2018. MMWR Surveillance Summaries, 70(11), 1-16. Original source
- Maenner, M. J., et al. (2023). Prevalence and characteristics of autism spectrum disorder among children aged 8 years: ADDM Network, 11 sites, United States, 2020. MMWR Surveillance Summaries, 72(2), 1-14. Original source
- Zuckerman, K. E., Lindly, O. J., & Chavez, A. E. (2017). Timeliness of autism spectrum disorder diagnosis and use of services among U.S. elementary school-aged children. Psychiatric Services. Original source
- NHS England. (2026). Integrated performance report, June 2026: Autism assessment waiting times, March 2026 data. Pages 83-84. Original source
- Dawson, G., et al. (2010). Randomized, controlled trial of an intervention for toddlers with autism: The Early Start Denver Model. Pediatrics, 125(1), e17-e23. Original source
- Geoffray, M.-M., et al. (2025). Early Start Denver Model effectiveness in young autistic children: A large multicentric randomised controlled trial in two European countries. BMJ Mental Health, 28(1), e301424. Original source
- Child and Adolescent Health Measurement Initiative. 2023 to 2024 National Survey of Children’s Health, Indicator 2.8: weighted population estimate for current autism at ages 3 to 17. Retrieved September 16, 2026. Population estimate table
- NHS England. (2026). Autism Statistics, July 2025 to June 2026. Published August 13, 2026. Includes provider submission and coverage limitations. Original source
More statistics and related pages
Talk it through with a licensed therapist
Autistic people and their families may seek support with relationships, work, anxiety or life changes. Psychology.com’s therapist directory provides a place to explore professional support.
This page is educational information, not a diagnosis or a substitute for professional care. If you are in crisis, call or text 988 (U.S. Suicide & Crisis Lifeline), any time.