
 By
By Reviewed by
SAMHSA’s 2025 National Survey on Drug Use and Health estimated that 54.6 million U.S. adults, or 20.6%, had a mental illness in the previous year, according to its release dated July 27, 2026. Among adults with any mental illness, 50.9% received mental health treatment. These estimates cover the civilian, noninstitutionalized population. Historical figures remain dated below because different survey years, definitions and report editions answer different questions.
Last full review: September 16, 2026 · sourced from NIMH, SAMHSA, the CDC, WHO, Mental Health America and peer-reviewed research.
Ten numbers that define mental health in the United States in 2026
- SAMHSA’s release dated July 27, 2026 estimated that 54.6 million U.S. adults, or 20.6%, had any mental illness in 2025. SAMHSA, 2025 NSDUH findings
- SAMHSA’s release dated July 27, 2026 estimated that 18.2 million U.S. adults, or 6.9%, had serious mental illness in 2025, a category involving substantial interference with major life activities. SAMHSA, 2025 NSDUH findings
- CDC’s 2025 NCHS report found that 13.1% of Americans aged 12 and older met a depression symptom threshold in August 2021 to August 2023, compared with 8.2% in 2013 to 2014. CDC, 2025
- SAMHSA’s release dated July 27, 2026 reported mental health treatment in 50.9% of U.S. adults with any mental illness and 67.7% of those with serious mental illness in 2025. SAMHSA, 2025 NSDUH findings
- SAMHSA reported that 61.4% of U.S. adults with any mental illness who perceived an unmet need for treatment in 2025 thought treatment would cost too much. SAMHSA, 2025 NSDUH findings
- Mental Health America’s 2025 edition reported 320 people per mental health provider in 2024, ranging from 140 to 1 in Alaska and Massachusetts to 740 to 1 in Alabama. Mental Health America, 2025
- 1.2 billion people worldwide, nearly one in seven, were living with a mental disorder in 2023, according to WHO's current estimate. WHO, 2023 data
- 12 billion working days are estimated to be lost globally each year to depression and anxiety, at US$1 trillion in lost productivity, according to WHO’s fact sheet dated September 15, 2026. WHO, September 15, 2026
- NCHS Data Brief 548 reported 48,824 U.S. suicide deaths in final 2024 mortality data, about 500 fewer than in 2023. NCHS Data Brief 548, 2026
- CDC reported that 21% of U.S. children aged 3 to 17 had ever been diagnosed with a mental, emotional or behavioral health condition as of 2021. CDC, 2021 data
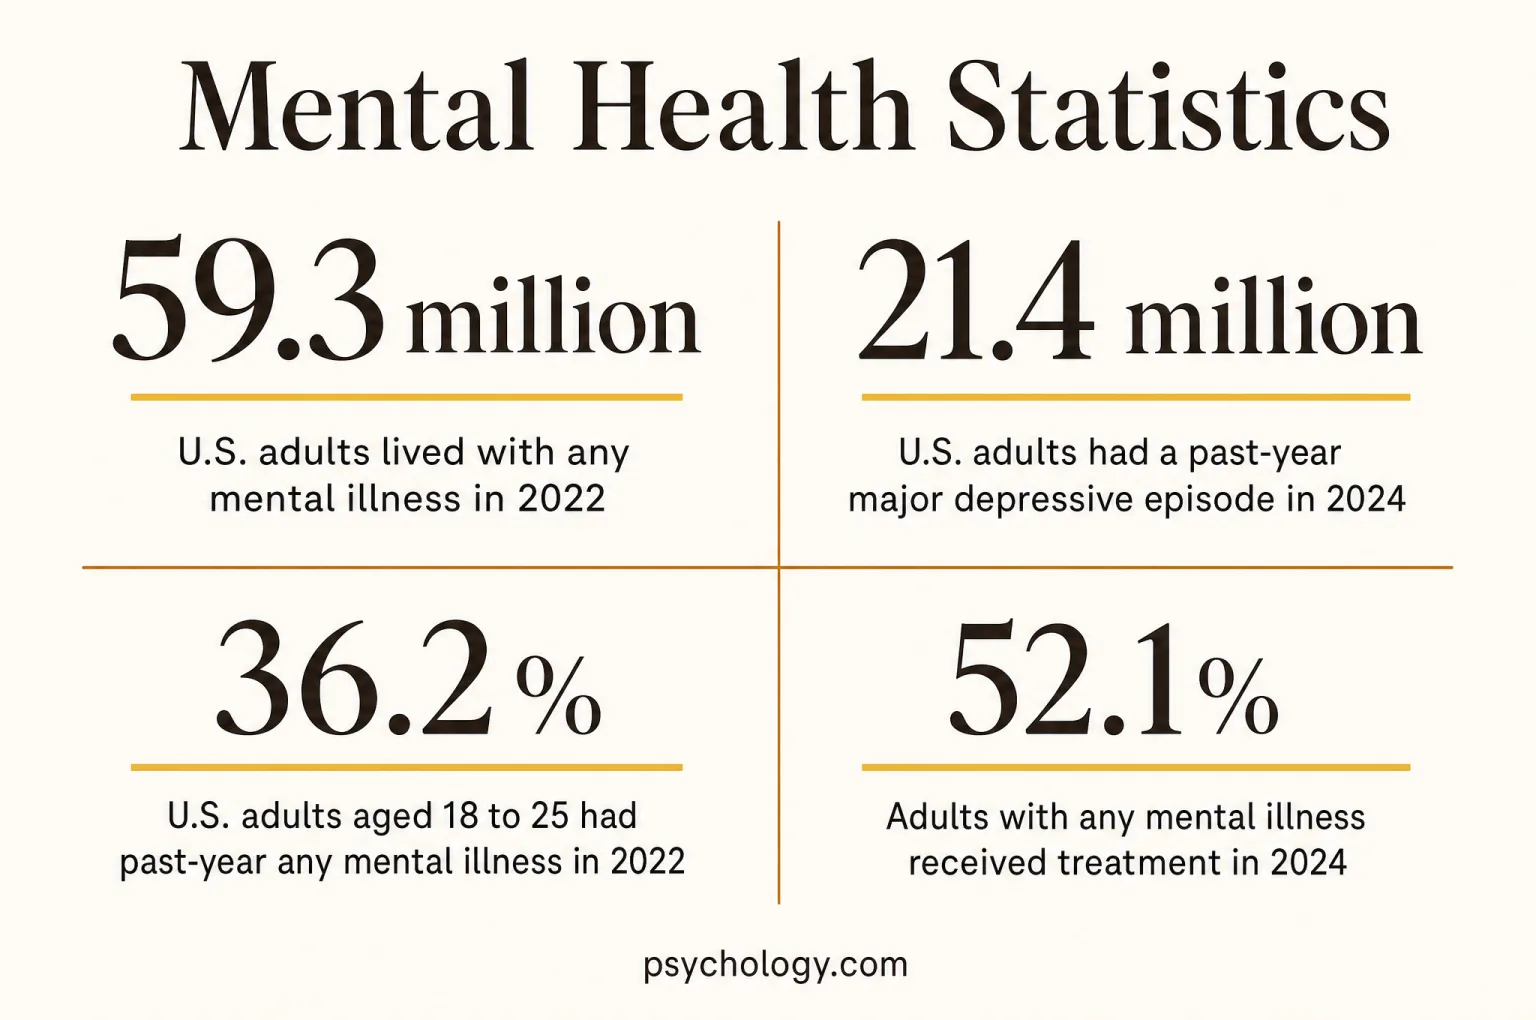
How common mental illness is in the U.S.
NIMH summarizes the National Survey on Drug Use and Health and presents 2022 data, while SAMHSA publishes newer rounds of that survey directly. These estimates cover the U.S. civilian, noninstitutionalized population. Any mental illness and serious mental illness are estimated from survey indicators using a prediction model informed by clinical interviews. SAMHSA’s July 27, 2026 release provides 2025 findings; the dated NIMH benchmark below remains useful for its demographic detail, while the newer national estimate appears alongside it.
U.S. adults lived with any mental illness in 2022
NIMH estimates past-year any mental illness at 59.3 million adults, or 23.1% of people aged 18 and older, using 2022 NSDUH data. This category covers diagnosable mental, behavioral or emotional disorders of varying severity and excludes developmental and substance use disorders. SAMHSA’s 2024 report gives 61.5 million adults and 23.4%. Both estimates are close to one in four. They describe the survey’s civilian, noninstitutionalized population; people in institutions, active-duty military personnel and people without a fixed address outside shelters are not fully represented. SAMHSA’s July 27, 2026 release subsequently reports 54.6 million adults, or 20.6%, for 2025. Comparing these separately published vintages alone cannot establish a like-for-like change in population prevalence.
NIMH, mental illness statistics · SAMHSA, 2024 NSDUH annual national report · SAMHSA, 2025 NSDUH findings
- 18.2 millionAdults with a serious mental illness in 2025
SAMHSA’s July 27, 2026 release reports 6.9% of adults with serious mental illness in 2025. This category requires substantial interference with major life activities and is a subset of any mental illness. The earlier 2024 report estimated 14.6 million adults, or 5.6%; those separately published estimates retain their own report years and should not be treated as a directly established trend.
SAMHSA, 2025 NSDUH findings · SAMHSA, 2024 NSDUH annual national report
- 19.7 millionAdults with a past-year major depressive episode in 2025
SAMHSA’s analysis of the 2025 NSDUH reports a major depressive episode in 7.4% of adults. Its earlier annual reports gave 21.4 million adults, or 8.2%, in 2024 and 21.9 million, or 8.5%, in 2023. These survey estimates identify episodes from reported symptoms and differ from clinician-recorded diagnoses; comparisons across releases require the corresponding survey definitions.
SAMHSA, 2025 NSDUH release analysis · SAMHSA, 2024 NSDUH annual national report · SAMHSA, 2023 NSDUH annual national report
- 15.1%Adolescents with a past-year major depressive episode in 2025
SAMHSA estimates 3.7 million adolescents ages 12 to 17 had a major depressive episode in 2025; this survey-based measure includes young people whose symptoms did not lead to a recorded diagnosis. The earlier 2024 estimate was 15.4%, with 11.3% of all adolescents having an episode with severe impairment; those impairment and prevalence figures remain specific to 2024.
SAMHSA, 2025 NSDUH findings · SAMHSA, 2024 NSDUH national report, archived 2025
- 13.1%People aged 12 and older screening positive for depression, August 2021 to August 2023
NCHS defined depression as a score of at least 10 on the PHQ-9 symptom questionnaire. It asks about the previous two weeks, so this measure differs from both a past-year major depressive episode and a diagnosis recorded by a health professional.
- 21.2 millionAdults with both a mental illness and a substance use disorder in 2024
Both conditions were reported within the same 12-month reference period. The survey cannot establish whether they occurred at the same time. This overlap also means the mental illness and substance use disorder totals cannot simply be added together.
- 86.6 millionAdults with a mental illness, a substance use disorder, or both in 2024
That is 33.0% of the adult population, or about one in three. The combined category counts each person once, including people who had both any mental illness and a substance use disorder during the previous year. It uses the survey’s population and diagnostic definitions.
- 54.6 millionU.S. adults with any mental illness in 2025
SAMHSA’s July 27, 2026 release places past-year any mental illness at 20.6% of adults. This national survey estimate counts a broader range of severity than serious mental illness and describes adults living in the civilian, noninstitutionalized population. It is distinct from a count of people who sought care or received a diagnosis.
Conditions by the numbers
The table summarizes the 18 condition and topic pages in this series, using each page’s dated prevalence figure or a newer directly matching estimate already present on that page. The accompanying links lead to the full condition statistics, with their sources and population definitions. Some topics, including loneliness and stress, describe experiences rather than diagnoses. Different survey years and reference periods make direct rankings between rows inappropriate.
U.S. adults had a past-year major depressive episode in 2024
SAMHSA estimated a major depressive episode in 8.2% of adults in 2024. NIMH’s separate historical anxiety estimate was 19.1%, using interviews conducted from 2001 to 2003. That older anxiety category included OCD and PTSD, which later moved to separate diagnostic groups. These figures show the importance of definitions, but they cannot establish a current ranking of diagnoses. A major depressive episode can also occur in more than one mood disorder, so an episode count should not be presented as a count of one diagnosis.
SAMHSA, 2024 NSDUH annual national report · NIMH, Any Anxiety Disorder
- 19.1%U.S. adults with a past-year anxiety disorder
NIMH’s estimate comes from the National Comorbidity Survey Replication, conducted from 2001 to 2003. Its broad historical anxiety category included OCD and PTSD. The estimate remains useful as a dated survey benchmark and should not be labeled as current prevalence.
- 2.8%U.S. adults with past-year bipolar disorder
The 2001 to 2003 survey also estimated lifetime prevalence at 4.4%. Past-year and lifetime measures answer different questions: the former concerns a recent period, while the latter includes earlier episodes even when someone is currently well. Neither measures diagnostic delay.
- 2.3%U.S. adults with lifetime OCD in the 2001 to 2003 survey
The National Comorbidity Survey Replication estimated lifetime prevalence at 2.3% and past-year prevalence at 1.2%. Lifetime prevalence includes episodes before the year of interview, including those that resolved. These historical estimates do not count current U.S. cases.
- About 6%U.S. adults with PTSD in their lifetime
The VA’s rounded estimate comes from the 2012 to 2013 NESARC-III survey. It includes people who experienced PTSD earlier in life and later recovered, so it is broader than the share currently experiencing PTSD. The VA’s epidemiology summary identifies the survey and diagnostic framework.
VA National Center for PTSD, historical survey estimate · VA, survey background
If you want a starting point rather than a number, the free general mental health assessment screens across several of these areas at once, and the full library of mental health tests covers individual conditions.
| Condition | Headline figure | Source |
|---|---|---|
| Depression | 8.5% of U.S. adults had a past-year major depressive episode in 2023 | SAMHSA, 2023 NSDUH |
| Anxiety | 19.1% of U.S. adults had a past-year anxiety disorder, 2001 to 2003 survey | NIMH, Any Anxiety Disorder |
| ADHD | 11.7% of U.S. children aged 3 to 17 had current ADHD in 2024 | Robinson et al., HRSA, 2026 |
| Autism | 1 in 31 children aged eight identified with autism in CDC surveillance communities in 2022 | Shaw et al., CDC ADDM surveillance, 2025 |
| PTSD | About 6% of U.S. adults in their lifetime, 2012 to 2013 survey | VA National Center for PTSD, historical survey estimate |
| OCD | 2.3% of U.S. adults had lifetime OCD, 2001 to 2003 survey | NIMH, OCD statistics (NCS-R 2001 to 2003) |
| Bipolar disorder | 2.8% of U.S. adults had past-year bipolar disorder, 2001 to 2003 survey | NIMH, NCS-R data from 2001 to 2003 |
| Schizophrenia | 27 million people worldwide in WHO’s estimate for 2023, published September 11, 2026 | WHO schizophrenia fact sheet, updated September 11, 2026 |
| Eating disorders | 28.8 million Americans alive in 2018 to 2019 projected to have an eating disorder in their lifetime | STRIPED and Deloitte Access Economics, 2020 |
| Addiction | 48.4 million U.S. people aged 12 and older had a past-year substance use disorder in 2024 | SAMHSA, 2024 NSDUH annual national report |
| Suicide | 48,824 U.S. suicide deaths in 2024 | NCHS Data Brief 548, January 2026 |
| Teen mental health | 39.7% of U.S. high school students reported persistent sadness or hopelessness in 2023 | Verlenden et al., CDC MMWR, 2024 |
| Postpartum depression | 13.2% reported postpartum depressive symptoms after a live birth across participating PRAMS sites in 2018 | CDC MMWR Vital Signs (Bauman et al.) |
| Men's mental health | 19.0% of U.S. adult men had past-year any mental illness in 2023 | SAMHSA, 2023 NSDUH detailed tables |
| Loneliness | 42% of U.S. adults reported loneliness at least once a week in the April 13 to April 15, 2026 poll | American Psychiatric Association: Annual mental health poll, 2026 |
| Burnout | 44% of surveyed U.S. employees felt burned out from work, 2024 report | SHRM: Employee Mental Health in 2024 |
| Stress | 24% of U.S. adults rated average stress 8 to 10 out of 10 in 2023 | APA, Stress in America 2023 press release, November 1, 2023 |
| Social media addiction | 17.4% pooled social media addiction screening prevalence, 2022 review of studies published before October 31, 2021 | Meng et al., Clinical Psychology Review, 2022 |
The depression statistics, anxiety statistics and bipolar disorder statistics explain how episodes, symptom screens and survey diagnoses differ. The OCD statistics, PTSD statistics and schizophrenia statistics retain the separate definitions and reference periods behind their prevalence and treatment estimates.
Developmental and life-stage measures receive fuller context in the ADHD statistics, autism statistics and postpartum depression statistics. The eating disorder statistics distinguish modeled lifetime projections from current cases, while the addiction statistics explain substance use disorders and their overlap with mental illness.
For individual reflection, Psychology.com offers a depression screener, an anxiety screener, an adult ADHD screener and a PTSD screener. Screening responses describe reported experiences and require their own interpretation; they do not establish a diagnosis or make a population percentage into an individual prediction.
Mental health by age, sex, race and income
The surveys show differences across age, sex, race and family income, but each comparison needs its own measure. NIMH’s any-mental-illness estimates, NCHS depression screening results and the Trevor Project’s recruited youth survey use different methods. Group averages describe patterns in those data and cannot predict an individual’s experience.
U.S. adults aged 18 to 25 had past-year any mental illness in 2022
NIMH reports 36.2% among adults aged 18 to 25, compared with 29.4% among those aged 26 to 49 and 13.9% among those aged 50 and older in 2022. Young adults had the highest estimate among these broad age groups. The comparison describes different people surveyed in the same year. It cannot show how a particular person’s mental health changes with age or determine how much of the difference reflects symptom reporting, life circumstances or other factors.
- 26.4% vs 19.0%Women compared with men, past-year any mental illness, 2023
SAMHSA’s 2023 detailed tables report 26.4% among adult women and 19.0% among adult men. The same dated estimates appear in the men’s mental health statistics. The survey’s male and female categories limit what this comparison can say about gender identity; group prevalence also differs from treatment receipt and recorded diagnosis.
- 35.2%Non-Hispanic multiracial adults with past-year any mental illness, 2022
NIMH reports 35.2% among adults identifying with two or more races, compared with 24.6% among non-Hispanic White adults and 16.8% among non-Hispanic Asian adults. These are unadjusted group estimates; they do not isolate the causes of the differences.
- 22.1% vs 7.4%Depression below the poverty level compared with 400% of poverty and above
Among people aged 12 and older in August 2021 to August 2023 NHANES data, depression screening prevalence was about three times higher in the lowest family-income group. This is a comparison between groups, rather than evidence that changing income caused a particular change in symptoms.
- 16.0% vs 10.1%Depression among females compared with males, aged 12 and older
In August 2021 to August 2023 NHANES data, depression was defined by the PHQ-9 symptom threshold. The overall difference was 5.9 percentage points. The observed female-male difference among adults aged 20 to 39 was not statistically significant, although the overall difference was.
- 62% and 47%Surveyed LGBTQ+ young people reporting recent anxiety and depression symptoms
The Trevor Project’s online survey recruited more than 16,000 U.S. LGBTQ+ people aged 13 to 24 from March 4, 2025, to October 15, 2025. Among respondents, 84% wanted care and 44% of those who wanted it could not obtain it. This recruited sample does not establish prevalence for all LGBTQ+ youth.
- 21%U.S. children aged 3 to 17 ever diagnosed with a mental, emotional or behavioral condition
As of 2021. In 2023 and 2024 survey data, 11% of children had current diagnosed anxiety, 8% had a behavior disorder and 4% had diagnosed depression.
The teen mental health statistics distinguish adolescent survey responses from parent-reported diagnoses. The men’s mental health statistics provide the fuller context for the sex comparisons, including the separately dated treatment estimates and the limits of household survey coverage.
Treatment, the care gap and workforce shortages
In 2025, about half of U.S. adults with any mental illness received treatment according to SAMHSA’s July 27, 2026 release. The earlier 2024 figure below is retained as a dated benchmark. Among adults who received none, some perceived a need and others did not. Reasons for going without care include expectations about managing symptoms independently, anticipated costs and difficulty finding a desired provider.
Adults with any mental illness received treatment in 2024
In 2024, 52.1% of adults with any mental illness and 70.8% of those with serious mental illness received mental health treatment. NSDUH counts inpatient or outpatient care, prescription medication, telehealth and treatment received in correctional settings during the past year. The remaining roughly three in ten adults with serious mental illness reported none of these treatment types. That category can still include people who used other support, since the survey separately records peer support, support groups and emergency-room services. SAMHSA’s newer release reports treatment receipt at 50.9% for any mental illness and 67.7% for serious mental illness in 2025. These percentages record service contact rather than whether care was adequate or symptoms improved.
SAMHSA, 2024 NSDUH annual national report · SAMHSA, 2025 NSDUH findings
- 67.7%Adults with a serious mental illness who received treatment in 2025
SAMHSA’s July 27, 2026 release reports past-year treatment in 67.7% of adults with serious mental illness. The earlier 2024 report gave 70.8%. Receipt of a qualifying service does not establish its duration, adequacy or outcome, and neither percentage measures how many people had all their care needs met.
SAMHSA, 2025 NSDUH findings · SAMHSA, 2024 NSDUH annual national report
- 59.3% vs 45.9%Women compared with men receiving treatment for a mental illness in 2023
SAMHSA’s 2023 detailed tables report mental health treatment among 59.3% of women and 45.9% of men with any mental illness. The corresponding child page uses these same figures and denominator. Receipt depends on both seeking and obtaining care, so the percentages alone cannot explain the reasons for the difference.
- 21.0%Untreated adults with a mental illness who felt they needed care
Among U.S. adults with any mental illness who received no mental health treatment in 2024, 21.0% said they sought care or thought they should get it. The remaining respondents did not report that perceived need; the survey does not establish that treatment would have been unnecessary.
- 61.4%Cited anticipated treatment cost among adults with unmet need in 2025
SAMHSA reports that 61.4% of adults with any mental illness who perceived an unmet need for treatment in 2025 thought treatment would cost too much; 72.9% thought they should manage on their own. The earlier reports gave anticipated-cost figures of 65.2% in 2024 and 59.8% in 2023. Respondents could report multiple reasons, and these percentages concern the unmet-need group.
SAMHSA, 2025 NSDUH findings · SAMHSA, 2024 NSDUH · SAMHSA, 2023 NSDUH
- 43.2%Could not find a desired provider or program among adults with unmet need in 2025
SAMHSA’s 2025 release analysis reports 43.2% among adults with any mental illness who perceived an unmet need for treatment. The earlier 2024 report gave 45.0%. This question concerns finding a desired professional or program and differs from the question about available appointments; respondents could report multiple barriers.
SAMHSA, 2025 NSDUH release analysis · SAMHSA, 2024 NSDUH annual national report
- 39.3%People aged 12 and older with depression who received counseling or therapy
From NCHS screening data covering August 2021 to August 2023: 43.0% of females and 33.2% of males with depression had seen a mental health professional for counseling or therapy in the previous 12 months.
- 50.9%Adults with any mental illness receiving treatment in 2025
SAMHSA’s July 27, 2026 release reports treatment receipt in 50.9% of adults with any mental illness, compared with the separately dated 52.1% estimate for 2024 above. A past-year service-contact measure cannot establish that support was continuous, effective or sufficient for every person.
| Measure and data year | U.S. figure | Lowest ratio or percentage | Highest ratio or percentage |
|---|---|---|---|
| Untreated adults with any mental illness reporting unmet need, 2022 and 2023 combined MHA 2025 | 25.2% | Maine, 13.1% | Wyoming, 37.8% |
| Adults with any mental illness who are uninsured, 2022 and 2023 combined MHA 2025 | 9.2% | Vermont, 3.3% | Texas, 19.4% |
| People per mental health provider, 2024 MHA 2025 | 320 to 1 | Alaska and Massachusetts, 140 to 1 | Alabama, 740 to 1 |
| Adults with 14+ mentally unhealthy days in the past month unable to see a doctor because of cost, 2023 MHA 2025 | 26.58% | Hawaii, 14.62% | Texas, 42.72% |
How to read the state access measures
MHA’s 2025 edition uses 2024 provider data and combined 2022 and 2023 NSDUH data for its insurance and unmet-need measures. Its glossary specifies that adults who received treatment are excluded from the unmet-need denominator. The 320-to-1 provider ratio uses the whole population and registered providers, some of whom may no longer be practicing or taking new clients. It cannot estimate an individual’s waiting time. The frequent-distress measure uses 2023 BRFSS data and asks about access to any doctor, rather than mental health treatment specifically. Sources: MHA, 2025 access rankings and MHA, measure definitions.
People exploring care can use the Psychology.com directory to find a licensed therapist and compare stated fees, insurance participation and appointment availability. These practical details concern individual access and are separate from statewide provider ratios. A behavioral activation worksheet provides a worksheet for recording everyday experiences; it does not assess whether a population-level treatment need has been met. The AI therapy statistics describe research on those tools and the limits of the evidence.
Impact: suicide, work and cost
These measures describe mortality, functioning, work and health expenditure. Each has a different denominator and purpose. Suicide mortality comes from death certificates, service spending counts expenditure, and the global work and disability estimates use modelling. Their totals cannot be added together to produce one measure of mental health’s impact.
People died by suicide in the United States in 2024
NCHS reports 48,824 suicide deaths in 2024, with an age-adjusted rate of 13.7 per 100,000. The rate declined 2.8% from 2023 in final mortality data. Counts describe lives lost, while age adjustment helps compare rates across populations with different age structures. These statistics do not establish an individual’s risk or identify a single cause for a death. The separate suicide statistics page provides context on mortality trends and prevention; the figures here should be read with that broader context in mind.
- 12 billionWorking days lost worldwide each year to depression and anxiety
WHO’s fact sheet dated September 15, 2026, presents this as an estimated annual loss associated with depression and anxiety. It is a global modelling figure, rather than a tally of recorded sick days in one country or a count of workers with a diagnosis.
- US$1 trillionAnnual global cost in lost productivity
WHO pairs this annual productivity estimate with the 12 billion working days figure in its September 15, 2026, fact sheet. It concerns lost output from depression and anxiety. It should be kept separate from spending on mental health services and from health losses measured in disability-adjusted life years.
- 16%Working-age adults worldwide estimated to have a mental disorder in 2023
WHO’s September 15, 2026 fact sheet estimates a mental disorder in 16% of working-age adults worldwide in 2023. The earlier fact sheet reported 15% for 2019. Working-age adults include people outside paid employment, so this is broader than a measure of employees with a recorded diagnosis; separately published estimates do not alone establish a trend.
- About $280 billionU.S. spending on mental health services in 2020
The White House Council of Economic Advisers reported on May 31, 2022, that about a quarter came from Medicaid. The $280 billion figure concerns spending on services in 2020. Economic losses associated with illness are a separate measure.
- 87.9%People aged 12 and older with depression reporting difficulty in daily activities
In August 2021 to August 2023 NHANES data, 87.9% of people meeting the PHQ-9 depression threshold reported at least some difficulty with work, home or social activities. This describes self-reported functioning; it does not calculate lost earnings or establish the size of an economic effect.
- 125.3 millionDisability-adjusted life years lost worldwide to mental disorders in 2019
GBD 2019 attributed 4.9% of global DALYs to mental disorders, ranking the group seventh. DALYs combine disability and premature mortality, but this analysis directly assigned deaths only to anorexia nervosa and bulimia nervosa. It therefore does not capture all excess mortality among people with mental disorders.
GBD 2019 Mental Disorders Collaborators, Lancet Psychiatry, 2022
Reading economic estimates carefully
Service spending, productivity loss and disability-adjusted life years answer different questions. Spending describes money allocated to care. Productivity estimates value lost output. DALYs measure lost healthy life and have no dollar unit. Keeping these categories separate avoids presenting an expenditure total as the full cost of illness or treating a modelled productivity loss as an observed bill. Each estimate also has its own population, reference period and uncertainty. Sources: White House Council of Economic Advisers, May 31, 2022 and WHO, September 15, 2026.
The suicide statistics place mortality measures alongside prevention and support information. Work-related experiences are covered in the burnout statistics and stress statistics, which distinguish occupational burnout from survey questions about stress. A stress diary is a worksheet for recording situations and responses, separate from the population measures summarized here.
Mental health trends over time
NHANES depression screening prevalence increased by about 60% between the 2013 to 2014 and August 2021 to August 2023 survey periods. Recent NSDUH data show lower adolescent major depressive episode estimates, while adult any-mental-illness prevalence is broadly stable. A difference between two estimates needs to be distinguished from a sustained or statistically significant trend. SAMHSA’s 2025 analysis describes adult any mental illness as stable across its 2021 to 2025 series and adolescent depressive episodes as declining; this is distinct from subtracting point estimates printed in different editions.
Depression prevalence rose by about 60% in a decade
NCHS used the PHQ-9 questionnaire to identify depression in people aged 12 and older. Prevalence rose from 8.2% in 2013 to 2014 to 13.1% in August 2021 to August 2023. That is an increase of 4.9 percentage points, or about 60% relative to the earlier estimate. The comparison concerns symptoms over the preceding two weeks in separate survey samples. It establishes an increase in measured prevalence but cannot, by itself, identify the causes or separate changes in onset, duration and reporting.
- 18.1% to 15.1%Youth aged 12 to 17 with a past-year major depressive episode, 2023 and 2025
The teen mental health page reports 18.1% in 2023, 15.4% in 2024 and 15.1% in 2025, each with its source edition. SAMHSA’s 2025 release describes a decline from 2021 through 2025 in its adolescent series. These population estimates do not follow individual adolescents or establish the reasons their experiences changed.
SAMHSA, 2025 NSDUH findings · SAMHSA, 2024 NSDUH national report, archived 2025
- 23.1% and 20.6%Published adult any-mental-illness estimates for 2022 and 2025
NIMH reports 23.1% for 2022, SAMHSA’s 2024 report gives 23.4% for 2024, and its July 27, 2026 release gives 20.6% for 2025. SAMHSA’s 2025 analysis describes the overall adult trend within its 2021 to 2025 series as stable. These separately published readings should therefore not be converted into a claimed decline without checking the comparable tables and methods.
NIMH, mental illness statistics · SAMHSA, 2024 NSDUH annual national report · SAMHSA, 2025 NSDUH findings · SAMHSA, 2025 NSDUH release analysis
- 8.5% and 7.4%Published adult major depressive episode estimates for 2023 and 2025
The earlier reports gave 21.9 million adults, or 8.5%, in 2023 and 21.4 million, or 8.2%, in 2024. SAMHSA’s 2025 release analysis reports 19.7 million adults, or 7.4%, and describes a declining adult MDE trend within its 2021 to 2025 series. That finding comes from the publisher’s series analysis; it does not identify causes or establish recovery for individuals.
SAMHSA, 2023 NSDUH annual national report · SAMHSA, 2024 NSDUH annual national report · SAMHSA, 2025 NSDUH release analysis
- Down 2.8%Change in the U.S. suicide rate from 2023 to 2024
The age-adjusted rate fell from 14.1 to 13.7 per 100,000. Separately, the number of deaths fell from 49,316 to 48,824, about 500 fewer. NCHS identifies both years as final data. The percentage change refers to the rate, rather than to the death count.
- 1,566.2 per 100,000Age-standardized global mental-disorder DALY rate in 2019
GBD estimated 1,566.2 DALYs per 100,000 in 2019, compared with 1,581.2 in 1990. Total DALYs rose from 80.8 million to 125.3 million across those years. The authors describe largely stable age-standardized rates alongside population growth and aging; an age-standardized rate differs from a crude per-person rate.
GBD 2019 Mental Disorders Collaborators, Lancet Psychiatry, 2022
| Measure | Earlier reading | Later reading | Source |
|---|---|---|---|
| Depression, aged 12 and older, two-week screen | 8.2% in 2013 to 2014 | 13.1% in August 2021 to August 2023 | CDC, 2025 |
| Adults with any mental illness, past year | 23.1% in 2022 | 20.6% in 2025; the separately published 2024 estimate was 23.4% | SAMHSA, 2024 NSDUH annual national report · SAMHSA, 2025 NSDUH findings · SAMHSA, 2025 NSDUH release analysis |
| Adults with a major depressive episode | 8.5% in 2023 | 7.4% in 2025; 8.2% in the 2024 report | SAMHSA, 2024 NSDUH annual national report · SAMHSA, 2025 NSDUH release analysis |
| Youth aged 12 to 17 with a major depressive episode | 18.1% in 2023 | 15.1% in 2025; 15.4% in the 2024 report | SAMHSA, 2025 NSDUH findings · SAMHSA, 2024 NSDUH national report, archived 2025 |
| Global DALYs from mental disorders | 80.8 million in 1990 | 125.3 million in 2019 | GBD 2019 Mental Disorders Collaborators, Lancet Psychiatry, 2022 |
Mental health by state and around the world
WHO’s current fact sheet uses a newer Global Burden of Disease release for its 2023 prevalence estimates. Earlier global estimates remain useful when clearly dated. Treatment coverage comes from separate sources, and MHA’s state measures use several U.S. surveys. Their different populations and definitions need to stay visible when comparing results.
People worldwide were living with a mental disorder in 2023
WHO’s fact sheet dated September 11, 2026, estimates 1.2 billion people with a mental disorder in 2023, nearly one in seven. Its 2022 World Mental Health Report used 2019 data: about 970 million people, or one in eight. The newer figure uses an updated Global Burden of Disease modelling release and a different reference year. Comparing these published totals does not establish a sudden real-world jump. The fact sheet does not quantify how much of the difference comes from model revisions versus changes in population or health.
WHO, mental disorders, September 11, 2026 · WHO, World Mental Health Report, 2019 data · WHO, summary of the 2019 estimate
- 970.1 millionGlobal mental-disorder cases estimated by GBD for 2019
The 2022 Lancet Psychiatry analysis estimated 970.1 million cases for 2019. WHO’s 2022 World Mental Health Report presented the rounded 970 million, or one in eight. This is a historical estimate from an earlier modelling release, rather than a second estimate of the 2023 population.
GBD 2019 Mental Disorders Collaborators, Lancet Psychiatry, 2022 · WHO, World Mental Health Report
- SeventhRank of mental disorders among leading causes of global disease burden
Mental disorders accounted for 4.9% of global disability-adjusted life years in 2019. The study ranked them seventh for DALYs and second worldwide for years lived with disability. Those rankings concern different measures of burden and should not be used interchangeably.
GBD 2019 Mental Disorders Collaborators, Lancet Psychiatry, 2022
- 40%Psychosis treatment coverage reported by WHO from Mental Health Atlas 2024
WHO reports 40% receiving formal care, citing Mental Health Atlas 2024. A separate depression review using studies from 2000 to 2019 estimated mental health service use at 33% in high-income locations and 8% in low- and lower-middle-income locations. The one-third figure applies specifically to the high-income group.
WHO, mental disorders fact sheet · Moitra et al., PLOS Medicine, 2022
- 25.2%Untreated U.S. adults with any mental illness reporting unmet need
MHA’s 2025 edition uses combined 2022 and 2023 NSDUH data and reports 25.2%, ranging from 13.1% in Maine to 37.8% in Wyoming. Its glossary explicitly excludes adults who received treatment from this measure. The denominator is therefore untreated adults with any mental illness.
- 9.2%U.S. adults with a mental illness who are uninsured
MHA’s 2025 edition estimates that over 5 million adults with any mental illness were uninsured in combined 2022 and 2023 data. It reports 3.3% in Vermont and 19.4% in Texas. Insurance status is distinct from whether an individual received treatment or could find an available provider.
Mental Health America, State of Mental Health in America 2025 · Mental Health America, access to care rankings
- 320 to 1People per mental health provider in the United States
MHA’s 2025 edition uses 2024 workforce data, with Alaska and Massachusetts at 140 to 1 and Alabama at 740 to 1. The count includes several professional groups, such as psychiatrists, psychologists and clinical social workers. Registered providers may include people no longer practicing or accepting new patients.
| Condition | People affected | Notes |
|---|---|---|
| Anxiety disorders | 470 million | Includes 146 million children and adolescents. WHO, Anxiety disorders · WHO, 2023 data |
| Depression | 322 million | Includes 43 million children and adolescents. WHO, September 11, 2026 · WHO, 2023 data |
| Conduct-dissocial disorder | 39 million | Children and adolescents only WHO, 2023 data |
| Bipolar disorder | 36 million | Includes 3.3 million people aged 10 to 19. WHO bipolar disorder fact sheet, September 11, 2026 · WHO mental disorders fact sheet, 2026 |
| Schizophrenia | 27 million | The all-age count differs from WHO’s adult prevalence of about 1 in 206 among people aged 20 and over. WHO schizophrenia fact sheet, updated September 11, 2026 |
| Eating disorders | 18 million | Includes 4.7 million children and adolescents WHO, 2023 data |
The loneliness statistics explain why a weekly loneliness question differs from a diagnosis, while the social media addiction statistics distinguish problematic-use screens from time spent online. WHO’s formal-care figure for psychosis also uses a different service measure from the specialist-care figure in its schizophrenia fact sheet; the two should retain their source definitions when quoted together.
Common questions
How many people have a mental illness in the United States?
SAMHSA estimated any mental illness in 54.6 million U.S. adults, or 20.6%, in 2025; 18.2 million adults, or 6.9%, had serious mental illness. The population covers civilian adults living outside institutions. NIMH’s historical summary reports 59.3 million adults, or 23.1%, for 2022. Different published vintages require their own definitions and should not be subtracted to establish a trend. Sources: SAMHSA, 2025 NSDUH findings and NIMH, mental illness statistics.
What share of people with a mental illness actually get treatment?
In 2025, 50.9% of U.S. adults with any mental illness and 67.7% with serious mental illness received mental health treatment. Receipt records service contact and cannot establish adequate care or recovery. Among adults with any mental illness who perceived unmet treatment need, 61.4% anticipated excessive cost and 43.2% could not find a desired provider or program. Those overlapping reasons concern that specific group. Sources: SAMHSA, 2025 NSDUH findings and SAMHSA, 2025 NSDUH release analysis.
Which mental health conditions are the most common?
There is no directly comparable current U.S. ranking in these sources. SAMHSA estimated a past-year major depressive episode in 19.7 million adults in 2025. NIMH’s historical anxiety estimate was 19.1% in a 2001 to 2003 survey using a broader diagnostic category. Among children aged 3 to 17 in 2023 and 2024 data, CDC reports current diagnosed anxiety in 11%, behavior disorders in 8% and depression in 4%. Those child measures reflect diagnoses reported by caregivers. Sources: SAMHSA, 2025 NSDUH release analysis, NIMH and CDC.
Is mental illness becoming more common?
The answer depends on the measure and series. Depression screening prevalence rose from 8.2% in 2013 to 2014 to 13.1% in August 2021 to August 2023. SAMHSA’s 2025 analysis describes adult any mental illness as stable and adolescent major depressive episodes as declining across its 2021 to 2025 series. Adolescents had a 15.1% episode estimate in 2025. These findings do not identify causes or track recovery in individuals. Sources: CDC, 2025, SAMHSA, 2025 NSDUH findings and SAMHSA, 2025 NSDUH release analysis.
Why is it so hard to find a therapist?
Provider supply and cost can both restrict access. Mental Health America’s 2025 edition reports 320 people per mental health provider using 2024 data, ranging from 140 to 1 in Alaska and Massachusetts to 740 to 1 in Alabama. In 2025, 61.4% of adults with any mental illness who perceived unmet treatment need anticipated excessive cost. Provider registrations do not reveal who accepts new appointments. Sources: MHA, 2025 access rankings and SAMHSA, 2025 NSDUH findings.
Where can someone get help right now?
In the United States, you can call or text the 988 Suicide and Crisis Lifeline at any time if you are struggling or worried about someone else. The service offers crisis support around the clock. For ongoing, non-urgent support, you can explore licensed therapists through the Psychology.com directory and check fees, insurance and availability before arranging an appointment. The AI therapy statistics page describes research on those tools. Crisis-support information: CDC.
Can people recover from a mental health condition?
Many adults describe themselves as being in recovery or having recovered. In the 2025 NSDUH, 44.1 million adults reported this status, representing 69.4% of those who perceived that they had ever had a mental health problem. This is a self-reported recovery measure, with a different denominator from past-year any mental illness. It cannot predict an individual’s course or establish that symptoms will never recur. Source: SAMHSA, 2025 NSDUH findings.
How we compiled this
We checked the statistics against primary publications, using archival or repository copies where direct access was blocked. The 18 condition rows were also compared with their independently verified sibling specs. NIMH and SAMHSA supply survey-model estimates of any mental illness; NCHS supplies PHQ-9 screening results from NHANES. WHO and GBD provide modelled global estimates. Data years, populations and service definitions remain attached because these measures are not interchangeable. Unresolved figures and unsupported causal explanations were removed. Source labels identify the originating publication, with official links retained when a copy was needed for verification. This page is scheduled for quarterly review. On September 16, 2026, all 18 final child specs were read and shared figures were reconciled against their stated values, populations, years and source links. Child figures were carried forward from those specs without a separate research pass. The hub’s NIMH, SAMHSA, WHO and Mental Health America pages were fetched with a browser user agent; SAMHSA used archive transport while citations retain publisher URLs. SAMHSA’s July 27, 2026 release and its accompanying analysis supplied the 2025 headline updates after the annual-report landing page failed. NAMI blocked access and supplied no replacement figures. NIMH’s demographic chart remains explicitly dated 2022, and the first four historical figure blocks retain the values summarized by the existing infographic. Newer readings are labeled separately. The figure count includes repeated displays in findings, data rows and tables, rather than claiming that every display is a distinct estimate. Last full review: September 16, 2026.
Journalists and researchers may reuse any statistic with attribution to the original source and a link to Psychology.com.
Cite this source
Fontane Pennock, S. (2026, September 13). Mental Health Statistics 2026. Psychology.com. https://psychology.com/mental-health-statistics/
References
- National Institute of Mental Health. (n.d.). Mental illness. nimh.nih.gov
- National Institute of Mental Health. (n.d.). Any anxiety disorder. nimh.nih.gov
- National Institute of Mental Health. (n.d.). Bipolar disorder. nimh.nih.gov
- National Institute of Mental Health. (n.d.). Obsessive-compulsive disorder (OCD). nimh.nih.gov
- Substance Abuse and Mental Health Services Administration. (2025). Key substance use and mental health indicators in the United States: Results from the 2024 National Survey on Drug Use and Health. samhsa.gov
- Substance Abuse and Mental Health Services Administration. (2024). Key substance use and mental health indicators in the United States: Results from the 2023 National Survey on Drug Use and Health. samhsa.gov
- Substance Abuse and Mental Health Services Administration. (2024). 2023 NSDUH detailed tables. samhsa.gov
- Brody, D. J., and Hughes, J. P. (2025). Depression prevalence in adolescents and adults: United States, August 2021 to August 2023. NCHS Data Brief No. 527. cdc.gov
- National Center for Health Statistics. (2026). Mortality in the United States, 2024. NCHS Data Brief No. 548. cdc.gov
- Centers for Disease Control and Prevention. (2026). Data and statistics on children's mental health. cdc.gov
- Verlenden, J. V., et al. (2024). Mental health and suicide risk among high school students. MMWR Supplements, 73(4). cdc.gov
- Bauman, B. L., et al. (2020). Vital signs: Postpartum depressive symptoms and provider discussions about perinatal mental health. MMWR, 69(19). cdc.gov
- Shaw, K. A., et al. (2025). Prevalence and early identification of autism spectrum disorder among children aged 4 and 8 years, ADDM Network, 16 sites, 2022. cdc.gov
- World Health Organization. (2026). Mental disorders fact sheet. who.int
- World Health Organization. (September 15, 2026). Mental health at work fact sheet. who.int
- World Health Organization. (2026). Schizophrenia fact sheet. who.int
- GBD 2019 Mental Disorders Collaborators. (2022). Global, regional, and national burden of 12 mental disorders in 204 countries and territories, 1990 to 2019. The Lancet Psychiatry, 9(2), 137 to 150. ncbi.nlm.nih.gov
- Mental Health America. (2025). The state of mental health in America 2025. mhanational.org
- Mental Health America. (2025). Access to care rankings. mhanational.org
- Council of Economic Advisers. (2022). Reducing the economic burden of unmet mental health needs. The White House. bidenwhitehouse.archives.gov
- The Trevor Project. (2026). 2025 U.S. national survey on the mental health of LGBTQ+ young people. thetrevorproject.org
- U.S. Department of Veterans Affairs, National Center for PTSD. (2026). How common is PTSD in adults? ptsd.va.gov
- STRIPED and Deloitte Access Economics. (2020). Social and economic cost of eating disorders in the United States of America. hsph.harvard.edu
- American Psychiatric Association. (2024). New APA poll: One in three Americans feels lonely every week. psychiatry.org
- SHRM. (2024). Employee mental health in 2024 research series. shrm.org
- American Psychological Association. (2023). Stress in America 2023: A nation recovering from collective trauma. apa.org
- Meng, S. Q., et al. (2022). Global prevalence of digital addiction in general population: A systematic review and meta-analysis. Clinical Psychology Review, 92. pubmed.ncbi.nlm.nih.gov
- Robinson et al., HRSA. (2026). NSCH ADHD prevalence and health care access, 2024 data brief. mchb.hrsa.gov
- World Health Organization. (2022). World mental health report: Transforming mental health for all. who.int
- Mental Health America. (2025). State of Mental Health in America: Glossary and measure definitions. mhanational.org
- Moitra, M., et al. (2022). The global gap in treatment coverage for major depressive disorder in 84 countries from 2000 to 2019. PLOS Medicine. journals.plos.org
- Substance Abuse and Mental Health Services Administration. (July 27, 2026). SAMHSA releases annual National Survey on Drug Use and Health: 2025 mental illness, treatment, unmet-need and recovery findings. SAMHSA, 2025 NSDUH findings
- Substance Abuse and Mental Health Services Administration. (July 27, 2026). Release of the 2025 NSDUH: Using data to drive the Great American Recovery. Adult depressive episodes, trend analysis and treatment barriers. SAMHSA, 2025 NSDUH release analysis
- American Psychiatric Association. (May 12, 2026). Annual mental health poll finds Americans anxious about current events, personal finances and emerging technology. Source
- World Health Organization. (September 11, 2026). Depressive disorder (depression). Fact sheet using GBD 2023 estimates. Source
- World Health Organization. (September 15, 2026). Anxiety disorders. Fact sheet citing Global Burden of Disease 2023 estimates. Source
- World Health Organization. (September 11, 2026). Bipolar disorder: fact sheet. who.int
- Substance Abuse and Mental Health Services Administration. (2024). 2023 NSDUH detailed tables: 5.4B, 6.1B, 6.21B and 6.37B. Official report
- National Center for PTSD. (2026). Epidemiology and impact of PTSD. U.S. Department of Veterans Affairs. Source.
- Substance Abuse and Mental Health Services Administration. (2025). Key substance use and mental health indicators in the United States: Results from the 2024 NSDUH. Archived report. Source.
- World Health Organization, Regional Office for Africa. (2022). Tanzania holds its first ever national mental health dialogue: summary of the historical 2019 global estimate. WHO Regional Office for Africa
More statistics and related pages
Talk it through with a licensed therapist
If any of these numbers describe your own year, a licensed therapist can help you work out what applies to you and what to do about it. Browse license-verified therapists on the internet's original directory.
This page is educational information, not a diagnosis or a substitute for professional care. If you are in crisis, call or text 988 (U.S. Suicide & Crisis Lifeline), any time.