
 By
By Reviewed by
CDC’s 2023 Youth Risk Behavior Survey found persistent sadness or hopelessness in 39.7% of U.S. high school students. SAMHSA’s newer 2025 household survey found a past-year major depressive episode in 15.1% of adolescents ages 12 to 17. These estimates describe different outcomes, populations and periods. A teen can experience distress without a recorded diagnosis, and neither percentage predicts an individual’s future. Treatment data and research on connection and support provide further context for the findings.
Last full review: September 16, 2026 · sourced from CDC, SAMHSA, NIMH, HRSA, NCES, Pew Research Center and peer-reviewed research.
Ten numbers that define teen mental health in 2026
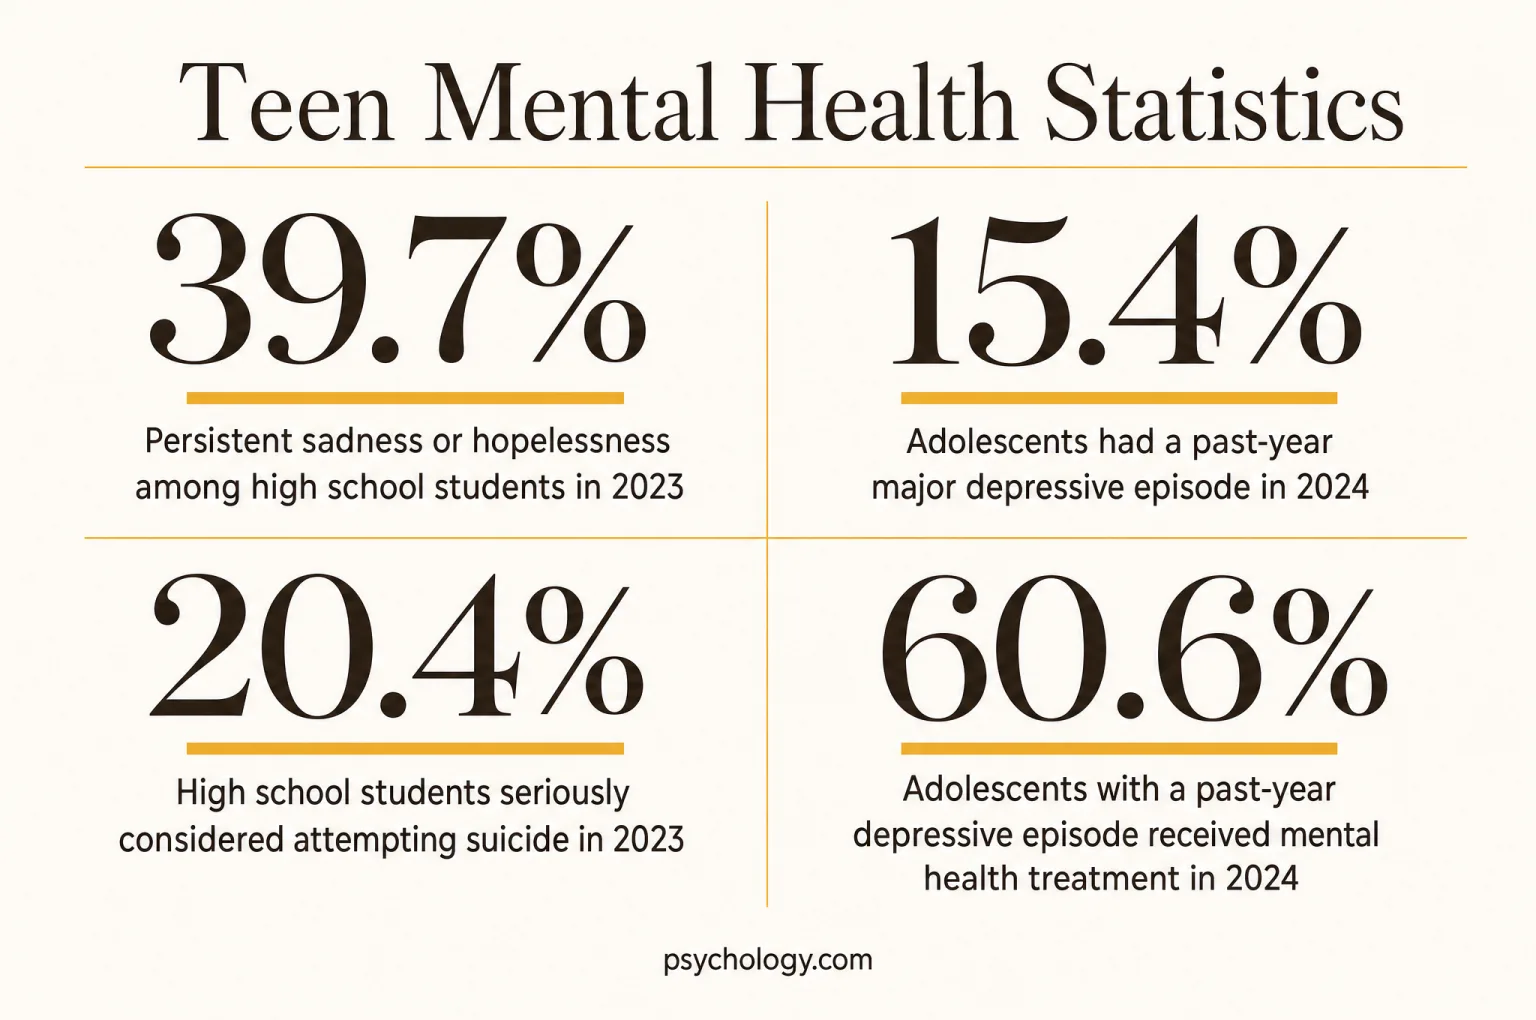
- CDC’s Youth Risk Behavior Survey found 39.7% of U.S. high school students reported persistent sadness or hopelessness in 2023, a measure of distress that interfered with usual activities. CDC, 2024
- SAMHSA’s 2025 NSDUH found a past-year major depressive episode in 15.1% of U.S. adolescents ages 12 to 17, a survey estimate distinct from recorded clinical diagnoses. SAMHSA, 2025 data released July 27, 2026
- SAMHSA’s 2025 NSDUH found moderate or severe anxiety symptoms over the previous two weeks in 18.0% of U.S. adolescents ages 12 to 17. SAMHSA, 2025 data released July 27, 2026
- 20.3% of adolescents ages 12 to 17 had current diagnosed anxiety, depression or behavior/conduct problems in 2023, according to HRSA’s analysis of parent reports. HRSA, 2024
- CDC’s Youth Risk Behavior Survey found 20.4% of high school students seriously considered attempting suicide in the previous year in 2023, showing the scale of prevention needs. CDC, 2024
- CDC’s Youth Risk Behavior Survey found 52.6% of female high school students reported persistent sadness or hopelessness in 2023, with a substantial sex difference in reported distress. CDC, 2024
- SAMHSA’s 2025 NSDUH found that 57.7% of adolescents ages 12 to 17 with a past-year major depressive episode received mental health treatment, which measures service receipt rather than adequacy of care. SAMHSA, 2025 data released July 27, 2026
- 52% of public K-12 schools agreed they could effectively provide mental health services to all students in need in March 2025, according to NCES’s current data file. NCES, March 2025 data
- CDC’s Youth Risk Behavior Survey found 77.0% of high school students used social media at least several times daily in 2023, an exposure measure rather than a diagnosis. CDC, 2024
- 19% of teens said social media hurt their mental health in Pew Research Center’s 2024 survey, reflecting their own assessment of its effects. Pew Research Center, 2025
How common mental health conditions are in teens
There is no single percentage that captures every kind of mental health difficulty. A household survey can count diagnosed conditions, while a school survey captures distress that may never reach a clinic. Age ranges and time windows also matter: a lifetime history answers a different question from symptoms during a recent fortnight.
Persistent sadness or hopelessness among high school students in 2023
The Youth Risk Behavior Survey asked about feeling so sad or hopeless almost every day for at least two consecutive weeks that students stopped some usual activities during the previous year. The result reflects disruption to ordinary life, without establishing a diagnosis of depression. Because the survey takes place in schools, its estimate describes enrolled high school students; young people outside that setting may have different experiences.
- 28.5%Poor mental health in the past month, high school students, 2023
Students selected “most of the time” or “always” when describing poor mental health, giving a shorter view of distress than the sadness question and including experiences beyond depression.
- 20.3%Current diagnosed anxiety, depression or behavior problems, ages 12 to 17, 2023
Parents reported whether a clinician had identified one of these conditions and whether it was still present, so the estimate depends partly on recognition and access to assessment.
- 3.8 millionAdolescents ages 12 to 17 with a depressive episode in 2024
This population estimate translates the NSDUH percentage into people, emphasizing how many families encounter a sustained cluster of depressive symptoms over the course of a year.
- 49.5%Any lifetime mental disorder, ages 13 to 18, 2001 to 2004
The NIMH figure comes from diagnostic interviews in the National Comorbidity Survey Adolescent Supplement and remains a historical benchmark rather than a measurement of teens in 2026.
- 61%Children ages 6 to 17 meeting all flourishing indicators, 2023 to 2024
Parent reports assessed curiosity, completing tasks and staying calm during challenges, showing that positive functioning can be measured alongside difficulties, although this broader age group includes younger children.
- 11%Current diagnosed anxiety, children ages 3 to 17, 2023 to 2024
The much wider childhood age range helps explain why this percentage differs from a teen-only estimate; the two denominators should remain visible whenever the figures are compared.
| Measure and population | Figure | Meaning and source |
|---|---|---|
| Current diagnosed depression, ages 3 to 17, 2023 to 2024 | 4% | Parent reports capture recognized conditions across childhood; this percentage is not a teen-only prevalence estimate. CDC children mental health data, NSCH |
| Current diagnosed behavior disorders, ages 3 to 17, 2023 to 2024 | 8% | This category adds a different part of mental health need and overlaps with other conditions in some children. CDC children mental health data, NSCH |
| Lifetime anxiety disorders, ages 13 to 18, 2001 to 2004 | 31.9% | The historical interview survey counts any qualifying anxiety disorder experienced before the interview, even if it had since improved. NIMH Any Anxiety Disorder |
Why these percentages should stay separate
The same adolescent can appear in several categories: a diagnosed anxiety disorder, a depressive episode during the year, and a period of persistent sadness. Adding the percentages would count some people repeatedly. Conversely, having no recorded diagnosis can reflect either good mental health or a difficulty that has not been assessed. Parent surveys offer insight into recognized needs, while confidential teen questionnaires give young people room to describe their own experience. Together they show several dimensions of mental health, including symptoms, functioning and contact with care. HRSA survey definitions; CDC survey definitions.
Depression and anxiety in teens
Depression and anxiety statistics depend on both symptom severity and the period being measured. The newest NSDUH estimates used here cover depressive episodes over a year and anxiety symptoms over two weeks. Parent-reported diagnoses add another perspective on conditions that have reached professional attention and are still considered present. New 2025 estimates appear alongside the dated 2024 detail; the older displays retain their original denominators and survey periods.
Adolescents had a past-year major depressive episode in 2024
SAMHSA classified an episode using a sustained period of depressed mood or lost interest together with other symptoms, such as changes in sleep, energy or concentration. The estimate covers adolescents ages 12 to 17 living in the civilian, noninstitutionalized population. It can include young people who never received a formal diagnosis or treatment. This is why the figure is especially useful for estimating the scale of depression-related need beyond existing patient records.
- 11.3%Depressive episode with severe impairment, all adolescents, 2024
The denominator is all adolescents ages 12 to 17, and severe impairment refers to substantial difficulty in home tasks, school or work, family relationships, or social life.
- 18.8%Moderate or severe anxiety symptoms, ages 12 to 17, 2024
The GAD-7 questionnaire measures recent symptom severity, so this result identifies elevated symptoms without confirming a generalized anxiety disorder diagnosis through a clinical interview.
- 23.1%Mild anxiety symptoms, ages 12 to 17, 2024
Mild scores describe a separate severity category and illustrate why combining every symptom level into one headline can obscure meaningful differences in the burden teens report.
- 8.2%Severe anxiety symptoms, ages 12 to 17, 2024
These respondents fall within the combined moderate-or-severe total, making this a subgroup of the higher-severity estimate rather than an additional group to add to it.
- 16.1%Current diagnosed anxiety, ages 12 to 17, 2023
The NSCH parent-reported estimate identifies recognized anxiety problems, offering a useful complement to symptom screening because it reflects a different route into being counted.
- 8.4%Current diagnosed depression, ages 12 to 17, 2023
Parents were asked about a diagnosis and whether depression was currently present, which makes this measure narrower in timing and recognition than a past-year episode.
- 15.1%Adolescents with a past-year major depressive episode in 2025
SAMHSA estimates 3.7 million adolescents ages 12 to 17 had a major depressive episode in 2025; this survey-based measure includes young people whose symptoms did not lead to a recorded diagnosis.
- 18.0%Adolescents with moderate or severe anxiety symptoms in 2025
The 2025 NSDUH found moderate or severe anxiety symptoms in the previous two weeks among 18.0% of adolescents ages 12 to 17; this symptom threshold differs from current parent-reported anxiety diagnoses.
| Measure and population | Figure | Meaning and source |
|---|---|---|
| Recent anxiety symptoms, NHIS-Teen, 2021 to 2023 | 20% | The national teen survey asked adolescents ages 12 to 17 directly about the previous two weeks. CDC children mental health data, NHIS-Teen |
| Recent depression symptoms, NHIS-Teen, 2021 to 2023 | 18% | A short symptom window can miss an earlier episode that would still count in a past-year measure. CDC children mental health data, NHIS-Teen |
| Elevated depression symptoms in international pandemic studies, 2020 to early 2021 | 25.2% | The pooled estimate comes from studies of children and adolescents during an exceptional period. Racine et al., JAMA Pediatrics, 2021 |
| Elevated anxiety symptoms in the same pandemic meta-analysis | 20.5% | Differences among countries, samples and screening tools limit how closely this estimate describes any particular school or community. Racine et al., JAMA Pediatrics, 2021 |
Symptoms and daily functioning are different measurements
A symptom score describes the experiences a person reports, while an impairment measure asks how much those experiences disrupt everyday roles. Both matter for understanding population need. A parent may notice school or household difficulties before knowing what a teen is feeling; a teen may describe distress before it becomes visible to others. The international pandemic estimates also combine younger children with adolescents and varied research settings, so they provide historical context rather than a current U.S. prevalence rate. SAMHSA measurement notes.
Psychology.com’s depression questionnaire and anxiety questionnaire use symptom questions; their results are a different kind of information from a population prevalence estimate or a professional diagnosis.
Teen suicide and self-harm
Thoughts of suicide, suicide attempts and nonsuicidal self-injury describe different experiences. Surveys can document how often students report them, but cannot predict what an individual will do. The distinctions matter for families, schools and reporting: these figures show prevention needs while leaving room for support, change and recovery.
High school students seriously considered attempting suicide in 2023
The CDC estimate refers to the previous year and to a specific self-report question about seriously considering an attempt. It describes thoughts rather than deaths, and it cannot be converted into a suicide mortality rate. Population findings help identify the reach of prevention needs, but they do not assign an outcome to any particular teen.
- 27.1%Female students reporting serious consideration, 2023
The higher prevalence among female students is a difference in self-reported thoughts during the previous year, and should be described separately from differences in suicide mortality.
- 14.1%Male students reporting serious consideration, 2023
A lower group average still represents substantial distress among male students and offers no basis for discounting an individual student’s experience or need for support.
- 12.6%Female students reporting an attempt, 2023
This past-year survey measure counts students reporting at least one attempt, so it describes people rather than the number of events or emergency department visits.
- 6.4%Male students reporting an attempt, 2023
The estimate uses the same question and time window as the female-student measure, allowing comparison within the survey while leaving clinical circumstances and outcomes unspecified.
- 41.0%LGBQ+ students reporting serious consideration, 2023
This sexual-identity grouping includes lesbian, gay, bisexual, questioning and other nonheterosexual identities, and CDC discusses the result alongside rejection, discrimination and other sources of stress.
- 13.0%Heterosexual students reporting serious consideration, 2023
The comparison describes a disparity between groups in the same school survey; it does not establish that sexual identity itself causes suicidal thoughts.
| Measure and population | Figure | Meaning and source |
|---|---|---|
| All high school students reporting an attempt, past year, 2023 | 9.5% | This measure should remain separate from thinking about an attempt and from the number of suicide deaths. Verlenden et al., CDC MMWR, 2024 |
| Pooled adolescent nonsuicidal self-injury prevalence, studies published 2000 to 2022 | 17.7% | The meta-analysis included ages 10 to 19 across 17 countries; its pooled estimate is not a current U.S. teen rate. Moloney et al., JAMA Network Open, 2024 |
| Adjusted prevalence ratios associated with high school connectedness, 2023 | 0.63 to 0.70 | Across four outcomes, students feeling closer to people at school reported lower prevalence than the comparison group. Verlenden et al., CDC MMWR, 2024 |
How to describe self-harm without implying an outcome
The self-injury meta-analysis defined its outcome as behavior occurring without suicidal intent. That distinction does not make the experience trivial, and it also means the estimate cannot be substituted for an attempt rate. The studies varied in location, design and measurement, making the pooled figure a broad research summary. The source does not present it as a current annual U.S. prevalence rate. In CDC’s school data, connectedness and supportive family circumstances were associated with lower prevalence of several risk indicators. Because these were observational comparisons, they do not show how much changing one circumstance would change a particular student’s risk. Moloney and colleagues; CDC protective-factor analysis.
Psychology.com’s warning signs worksheet and safety plan worksheet describe prompts for recognizing concerns and identifying support. These materials cannot establish a young person’s immediate safety or predict an individual outcome. The crisis-support FAQ below provides contact information for people who need help now.
Who is most affected
National averages hide important differences in reported distress. Female students, sexual-minority students and transgender students often report greater burdens, although these categories overlap. The surveys describe experiences within social settings, including safety and belonging. Their results support attention to unequal conditions without treating any identity as an explanation on its own.
Female high school students reported persistent sadness or hopelessness in 2023
The CDC result uses the same past-year question for all students and reflects feelings that interrupted usual activities. Sex differences appear across several measures, but the size of a difference depends on the outcome being studied. Reading those findings together requires care because the groups overlap and are not interchangeable.
- 27.7%Male students with persistent sadness or hopelessness, 2023
The male-student result shows that substantial distress extends across sex categories, even though the survey found a higher prevalence among female students.
- 38.8%Female students with poor mental health, 2023
This shorter measure concerns mental health during the previous month, making it a different view of the burden from sadness that occurred at any point during the year.
- 18.8%Male students with poor mental health, 2023
Using the same recent-period question helps make the sex comparison consistent, while leaving differences in symptom recognition and willingness to report outside the estimate.
- 65.7%LGBQ+ students with persistent sadness or hopelessness, 2023
The elevated prevalence reflects the experiences of a diverse sexual-minority group and should be understood alongside social stressors rather than as an inherent feature of identity.
- 31.4%Heterosexual students with persistent sadness or hopelessness, 2023
This comparison comes from the same national survey and demonstrates how much an overall average can conceal when groups report different levels of distress.
- 71.9%Adjusted prevalence of persistent sadness or hopelessness among transgender students, 2023
This estimate was adjusted for race and ethnicity and grade, so it should retain that label when compared with the unadjusted figures in other CDC analyses.
- 61% / 50%Recent anxiety and depression symptoms among LGBTQ+ respondents ages 13 to 17 in 2025
The Trevor Project’s 2025 voluntary survey reports anxiety symptoms in 61% and depression symptoms in 50% of its teen respondents; these overlapping groups describe the recruited sample and do not establish national prevalence.
| Measure and population | Figure | Meaning and source |
|---|---|---|
| Poor mental health in the past month, LGBQ+ students | 53.5% | The shorter time window still shows a substantial reported burden. Verlenden et al., CDC MMWR, 2024 |
| Poor mental health in the past month, heterosexual students | 21.5% | The comparator uses the same question and response categories. Verlenden et al., CDC MMWR, 2024 |
| Past-year attempt, LGBQ+ students | 19.7% | This disparity concerns self-reported behavior and does not establish an individual prognosis. Verlenden et al., CDC MMWR, 2024 |
| Past-year attempt, heterosexual students | 6.0% | The percentage describes the same outcome in the comparison group. Verlenden et al., CDC MMWR, 2024 |
What the Trevor Project survey adds
The Trevor Project’s 2024 report, based on an online sample recruited in 2023, provides detail about LGBTQ+ young people’s experiences. Among respondents ages 13 to 17, in-person bullying was reported by 49% and electronic bullying by 35%. Across respondents ages 13 to 24, recent anxiety symptoms were reported by 66% and depression symptoms by 53%. These findings describe the recruited sample, which included young adults and was not a national probability sample of all LGBTQ+ teens. Trevor Project survey and methods.
Psychology.com’s parenting resources provide additional context for family conversations about young people’s emotional lives, school experiences and relationships.
Treatment and the care gap
Treatment statistics depend on who is included and what counts as care. A percentage among teens with depression differs from a percentage among all students. Surveys also distinguish receiving some help, wanting help, and having difficulty obtaining it. Each highlights a distinct part of access. New 2025 estimates appear alongside the dated 2024 detail; the older displays retain their original denominators and survey periods.
Adolescents with a past-year depressive episode received mental health treatment in 2024
The NSDUH measure includes inpatient or outpatient care, prescribed medication, telehealth and treatment in correctional settings. It records whether any qualifying care occurred during the previous year, without establishing that it was sufficient, continuous or specifically for depression. Some adolescents used more than one type of care, so the treatment categories overlap. The result leaves a substantial group with a depressive episode and no qualifying mental health treatment.
- 50.8%Outpatient treatment among adolescents ages 12 to 17 with a past-year depressive episode, 2024
This includes care outside an inpatient admission and represents one part of the broader treatment measure, rather than a separate population to add to it.
- 33.2%Telehealth among adolescents ages 12 to 17 with a past-year depressive episode, 2024
Remote delivery can overlap with outpatient counseling or other treatment, so it describes how care was accessed as well as whether contact occurred.
- 31.2%Prescribed mental health medication among adolescents ages 12 to 17 with a past-year depressive episode, 2024
Medication receipt does not identify the specific condition treated, the medication used or whether symptoms improved, and can coincide with counseling.
- 28.5%Any mental health treatment among all adolescents, 2024
This broader denominator includes adolescents with other conditions or needs, illustrating why it cannot be read as the treatment rate for depression.
- 52%Public schools reporting capacity to serve all students in need, March 2025
NCES’s current School Pulse Panel workbook reports 52% agreement in March 2025, compared with 47% in its March 2024 column; the question measures school-reported capacity rather than individual students’ receipt of care.
NCES School Pulse Panel, March 2025 data in the current results file
- 61.0%Difficulty obtaining needed care among diagnosed adolescents, 2023
Parents reported access difficulties among adolescents with a current diagnosis who needed treatment; someone could ultimately receive care and still face substantial difficulty obtaining it.
- 57.7%Treatment among adolescents with a depressive episode in 2025
Among adolescents ages 12 to 17 with a past-year major depressive episode, 57.7% received mental health treatment in 2025; service receipt does not establish adequate, continuous or depression-specific care.
- 27.6%Any mental health treatment among all adolescents in 2025
SAMHSA reports past-year mental health treatment in 27.6% of all adolescents ages 12 to 17 in 2025; this denominator includes young people with conditions and concerns beyond depressive episodes.
| Measure and population | Figure | Meaning and source |
|---|---|---|
| Public K-12 schools offering some mental health service, 2024 | 97% | Offering a service does not establish enough capacity for every student needing it. NCES School Pulse Panel, March 2024 data in the current results file |
| Public schools reporting staffing limits, March 2025 | 51% | Insufficient mental health staff coverage was a common barrier to meeting student needs. NCES School Pulse Panel, March 2025 data in the current results file |
| Adolescents reporting unmet needs, NHIS-Teen, 2021 to 2023 | 20% | Young people’s own reports capture a different perspective from school or parent assessments. CDC children mental health data, NHIS-Teen |
Privacy and expectations can shape access
Among untreated adolescents with a past-year depressive episode and perceived unmet need in 2024, 90.5% said they thought they should handle their concerns themselves, and 64.9% worried information would not remain private. Both percentages use this restricted group as their denominator. SAMHSA access questions. In the Trevor Project’s 2023 online sample of LGBTQ+ respondents ages 13 to 24, 84% wanted care, 42% received counseling, and 50% of those wanting care could not obtain it. Trevor Project, 2024.
Psychology.com’s child therapy resources explain the context of services for young people and families; the national percentages above describe access across many different care settings.
Psychology.com’s directory can help families find a licensed therapist and review a provider’s experience with adolescents. Availability, setting and services differ across communities. The national treatment percentages describe whether contact occurred; they do not establish what a specific local provider offers or how long an individual family might wait for an appointment.
Trends over time
Recent findings show both improvement and continued need. Comparable NSDUH estimates of adolescent depressive episodes declined after 2021, while parent-reported diagnoses had risen over a longer period. Changes in survey methods, service use and recognition can affect these patterns. The data years below remain separate from this page’s 2026 publication date.
Past-year adolescent depression declined to 15.4% in 2024
In the comparable NSDUH series, past-year major depressive episodes fell from 20.8% in 2021. SAMHSA revised the 2021 survey weights for comparisons with later years, so the earlier published NIMH estimate of 20.1% should not be substituted into this trend. These results describe separate samples of adolescents over time; they cannot establish how many individual teens recovered or which experiences explain the population change. NIMH’s original 2021 estimate.
- 19.5%Adolescent depressive episodes in 2022
This estimate belongs to the comparable series in SAMHSA’s 2024 report, keeping the historical measurement consistent with the later observations.
- 18.1%Adolescent depressive episodes in 2023
The household survey continued to show a substantial burden even as the comparable series moved downward from its 2021 level.
- 61%Increase in diagnosed adolescent anxiety, 2016 to 2023
HRSA reports a relative increase in parent-reported current diagnoses, which can reflect changes in underlying need alongside changes in recognition and assessment.
- 60.0%Increase in diagnosed depression prevalence, 2017 to 2021
The Southern California health-system study included insured patients ages 5 to 22, making its regional findings informative without representing every U.S. teen.
- 31%Relative increase in the mental health share of ED visits, ages 12 to 17, 2020 versus 2019
CDC compared weeks 12 to 42 in reporting emergency departments. The finding concerns the proportion of visits, which can rise when other emergency visits fall, without an equivalent rise in mental health visit counts.
- 37%Moderate or severe depressive symptoms among college students, 2024 to 2025
UCLA’s summary of the 2024 to 2025 Healthy Minds Study reports moderate to severe depressive symptoms in 37% of participating college students. This campus-based result provides context for the transition beyond adolescence and should not be interpreted as a national teen prevalence estimate or proof of improvement within individual students.
UCLA Center for Health Policy Research, Healthy Minds Study, September 9, 2025
| Measure and population | Figure | Meaning and source |
|---|---|---|
| 2019 YRBS, before the pandemic | 36.7% | The measure asked about a sustained period of sadness affecting usual activities during the preceding year. Bitsko et al., CDC MMWR, 2022 |
| 2021 YRBS, summarized in CDC’s 2024 report | Over 42% | Reported sadness was above the earlier level during the pandemic period. CDC MMWR, 2024, describing 2021 YRBS |
| 2023 YRBS | 39.7% | The later estimate remained above the 2019 figure despite being below the pandemic-period summary. Verlenden et al., CDC MMWR, 2024 |
What a timeline can establish
The Surgeon General’s 2021 advisory described disrupted schooling, reduced social contact, interrupted services and bereavement as part of the pandemic context. It cited more than 140,000 U.S. children losing a parent or grandparent caregiver by June 2021. That estimate helps describe the period without attributing every later mental health change to one cause. Surgeon General advisory, 2021. Annual surveys can identify changing patterns, but they do not isolate the contributions of the pandemic, social conditions, school experiences or technology.
Social media and screens
Screen time includes many different activities, from messaging a friend to watching videos or completing homework. Social media research adds further distinctions between frequency, duration, content and personal experience. A high-use percentage says how common an exposure is; understanding its relationship with mental health requires a different kind of study.
High school students used social media several times daily or more in 2023
CDC’s frequency question grouped students using social media several times a day, about hourly or more than hourly. It did not measure total hours or diagnose problematic use. Frequent use was associated with persistent sadness and some other adverse experiences in this survey, but exposure and outcomes were reported at the same time. That design cannot establish which came first or how much other circumstances contributed to the association.
- 19%Teens saying social media hurt their mental health, 2024
Pew asked teens ages 13 to 17 to assess their own experience, providing a perception measure rather than a clinical assessment of harm.
Pew Research Center, Teens, Social Media and Mental Health, 2025
- 74%Teens reporting connection with friends through social media, 2024
Perceived connection is a benefit that can coexist with negative experiences, so positive and negative responses should not be treated as mutually exclusive.
Pew Research Center, Teens, Social Media and Mental Health, 2025
- 45%Teens saying social media hurt their sleep, 2024
This reflects teens’ reported experience of sleep disruption rather than an objectively measured change in sleep duration or proof of a psychiatric condition.
Pew Research Center, Teens, Social Media and Mental Health, 2025
- 34%Teens using social media for mental health information, 2024
The result concerns information seeking at least sometimes and does not establish the quality of that information or the receipt of professional care.
- 96%Teens using the internet daily, 2024
Pew’s broader internet-use measure covers more activities than social media, so it should remain distinct from platform frequency or addiction claims.
- 1.60Adjusted association with internalizing problems alone, U.S. cohort, 2013 to 2016
Participants were ages 12 to 15 at baseline. For more than three through six daily hours of social media versus none, the adjusted relative risk ratio for past-year internalizing problems alone was 1.60 (95% confidence interval, 1.11 to 2.31). This observational association does not establish causation.
- 8%Parents saying social media helps their teen’s mental health, 2025
Pew’s survey, fielded September 25, 2025 to October 9, 2025, found that 8% of parents said social media helped their teen’s mental health; this parental perception differs from a teenager’s own report or a measured clinical outcome.
Why hours alone do not explain the association
The Riehm study followed U.S. young people across survey waves and adjusted for measured background differences. The quoted estimate concerns internalizing problems alone, a separate category from co-occurring internalizing and externalizing problems. Internalizing problems include difficulties such as depression and anxiety; the relative risk ratio is a measure of association. Adjustment reduces some alternative explanations, while unmeasured differences and changes in use remain possible. The estimate should therefore retain its outcome, comparison group and historical data period. Different findings can also emerge when studies ask about total time, specific online experiences or a teen’s own evaluation of how a platform affects them. Riehm and colleagues, 2019.
Connection, content and uncertainty
The Surgeon General’s 2023 advisory cited social media use among up to 95% of young people ages 13 to 17 from a 2022 survey and emphasized gaps in independent safety research. Surgeon General advisory, 2023. The reach of these platforms makes their design and content relevant to population health, but widespread use by itself does not establish harm. Teenagers can experience support, exclusion, creativity and pressure in different online settings. A single total for screen hours cannot identify which of those experiences mattered for a particular young person.
Common questions
What percentage of teens have a mental health condition?
The answer depends on the condition and measurement. In 2023, parents reported current diagnosed anxiety, depression or behavior/conduct problems for 20.3% of adolescents ages 12 to 17. Separately, 39.7% of high school students reported persistent sadness or hopelessness. The first estimate counts recognized conditions; the second counts disruptive feelings. They overlap, so adding them would overstate the total. HRSA, 2024; CDC, 2024.
How common are depression and anxiety among teens?
SAMHSA’s 2025 NSDUH reports that 15.1% of U.S. adolescents ages 12 to 17 had a past-year major depressive episode and 18.0% had moderate or severe anxiety symptoms in the previous two weeks. These estimates use different time windows, and some adolescents experience both. The symptom measure does not establish a clinical anxiety diagnosis, and the groups should not be added together to estimate all teens with mental health difficulties. SAMHSA, 2025 NSDUH findings.
Is teen mental health improving or getting worse?
The evidence shows different patterns depending on the outcome and years compared. SAMHSA’s comparable estimates of adolescent depressive episodes declined from 20.8% in 2021 to 15.4% in 2024. Parent-reported adolescent anxiety diagnoses increased over 2016 to 2023. These findings can coexist because they measure different conditions and periods. Changes in recognition and access to assessment also affect diagnosis counts. The 2026 title identifies this edition, without implying new 2026 survey results. SAMHSA; HRSA.
How many teens with depression receive treatment?
In SAMHSA’s 2025 NSDUH, 57.7% of adolescents ages 12 to 17 with a past-year major depressive episode received mental health treatment. That measures whether some qualifying care occurred during the year. It does not establish that treatment was continuous, sufficient or specifically for depression. School capacity, parent-reported access difficulties and household treatment surveys describe different parts of the care gap, so their percentages are not interchangeable. SAMHSA, 2025 NSDUH findings.
Does social media cause teen depression?
The cited observational studies do not establish that social media causes teen depression. CDC found associations between frequent use and several adverse experiences, while Pew documented teens’ own reports of both benefits and harms. A longitudinal U.S. study found an adjusted association with internalizing problems, but unmeasured differences could still matter. Duration, content, circumstances and the direction of the relationship all affect interpretation. CDC; Riehm and colleagues.
How should teen suicide and self-harm statistics be interpreted?
Thoughts, attempts, nonsuicidal self-injury and suicide deaths are separate outcomes. In 2023, 20.4% of high school students seriously considered attempting suicide during the previous year. That percentage cannot predict an individual’s future or be read as a death rate. Support is available: in the United States, call or text 988 to reach the Suicide & Crisis Lifeline if you or someone you know is in crisis or thinking about suicide. CDC, 2024.
How does mental health differ for LGBTQ+ teens?
CDC’s 2023 school survey found persistent sadness or hopelessness in 65.7% of LGBQ+ students and 31.4% of heterosexual students. The Trevor Project’s separate 2025 voluntary sample found recent anxiety symptoms in 61% and depression symptoms in 50% of LGBTQ+ respondents ages 13 to 17. These studies use different recruitment and measurement methods. The differences warrant attention to safety, belonging and access to support without treating identity as a cause or an individual prognosis. The Trevor Project, 2025 survey, published May 6, 2026.
How we compiled this
Statistics come from fetched federal reports, primary surveys and peer-reviewed studies. U.S. population estimates lead; international research and college samples carry separate labels. Each figure preserves its source denominator, time window and data year. The 2024 NSDUH report was read through an archived copy, including its revised historical estimates. Parent-reported diagnoses, symptom screens, lifetime disorders and recent distress are presented separately. Observational associations do not establish causation. Survey estimates include sampling and reporting uncertainty, and treatment receipt does not establish treatment quality. Sources were checked on September 13, 2026; the title identifies this edition rather than a year of data collection. The September 16, 2026 update fetched the 2025 NSDUH release, Trevor Project’s 2025 survey, Pew’s April 15, 2026 report and NCES’s current results workbook. The NCES All Schools sheet supplied the March 2025 collapsed agreement and all-school staffing measures; older school-service availability remains dated March 2024. UCLA’s study-author summary supplied the newer Healthy Minds estimate after the report PDFs blocked curl. The dated 2024 NSDUH detail remains alongside the newly added 2025 rows, preserving historical context without inferring individual recovery or causal effects. Last full review: September 16, 2026.
Journalists and researchers may reuse any statistic with attribution to the original source and a link to Psychology.com.
Cite this source
Fontane Pennock, S. (2026, September 13). Teen Mental Health Statistics 2026. Psychology.com. https://psychology.com/teen-mental-health-statistics/
References
- Verlenden, J. V., et al. (2024). Mental health and suicide risk among high school students and protective factors, YRBS 2023. MMWR Supplements, 73(4), 79-86. Source.
- Substance Abuse and Mental Health Services Administration. (2025). Key substance use and mental health indicators in the United States: Results from the 2024 NSDUH. Archived report. Source.
- Sappenfield, O., et al. (2024). Adolescent mental and behavioral health, 2023. HRSA National Survey of Children’s Health Data Briefs. Source.
- Centers for Disease Control and Prevention. (2026). Data and statistics on children’s mental health. NSCH and NHIS-Teen data. Source.
- National Institute of Mental Health. (n.d.). Mental illness. Adolescent lifetime estimates from the 2001 to 2004 NCS-A. Source.
- National Institute of Mental Health. (n.d.). Any anxiety disorder. Adolescent lifetime estimates from the 2001 to 2004 NCS-A. Source.
- National Institute of Mental Health. (n.d.). Major depression. Original 2021 NSDUH estimates. Source.
- Suarez, N. A., et al. (2024). Disparities in school connectedness, housing, violence and mental health among transgender and cisgender students, YRBS 2023. MMWR Supplements, 73(4), 50-58. Source.
- The Trevor Project. (2024). U.S. national survey on the mental health of LGBTQ+ young people. Survey fielded in 2023. Source.
- National Center for Education Statistics. (n.d.). School Pulse Panel: Mental Health and Well-Being. Current results workbook, All Schools sheet, March 2025 and March 2024 columns. Source.
- Bitsko, R. H., et al. (2022). Mental health surveillance among children, United States, 2013 to 2019. MMWR Supplements, 71(2), 1-42. Source.
- Leeb, R. T., et al. (2020). Mental health-related emergency department visits among children during the COVID-19 pandemic. MMWR, 69, 1675-1680. Source.
- Moloney, F., et al. (2024). Sex differences in the global prevalence of nonsuicidal self-injury in adolescents: A meta-analysis. JAMA Network Open, 7(6), e2415436. Source.
- Racine, N., et al. (2021). Global prevalence of depressive and anxiety symptoms in children and adolescents during COVID-19: A meta-analysis. JAMA Pediatrics, 175(11), 1142-1150. Source.
- Xiang, A. H., et al. (2024). Depression and anxiety among US children and young adults. JAMA Network Open, 7(10), e2436906. Source.
- Healthy Minds Network. (n.d.). The Healthy Minds Study: 2023 to 2024 data report. National report, pages 4 and 6. Source.
- Office of the Surgeon General. (2021). Protecting youth mental health: The U.S. Surgeon General’s advisory. U.S. Department of Health and Human Services. Source.
- Office of the Surgeon General. (2023). Social media and youth mental health: The U.S. Surgeon General’s advisory. U.S. Department of Health and Human Services. Source.
- Young, E., et al. (2024). Frequent social media use, bullying, sadness and suicide risk among high school students, YRBS 2023. MMWR Supplements, 73(4), 23-30. Source.
- Riehm, K. E., et al. (2019). Associations between time spent using social media and internalizing and externalizing problems among US youth. JAMA Psychiatry, 76(12), 1266-1273. Source.
- Faverio, M., Anderson, M., & Park, E. (2025). Teens, social media and mental health. Pew Research Center. Source.
- Pew Research Center. (2024). Teens, social media and technology 2024. Survey of U.S. teens ages 13 to 17. Source.
- Substance Abuse and Mental Health Services Administration. (July 27, 2026). Annual National Survey on Drug Use and Health release: adolescents with a past-year major depressive episode in 2025. SAMHSA, 2025 NSDUH findings
- Substance Abuse and Mental Health Services Administration. (July 27, 2026). Annual National Survey on Drug Use and Health release: adolescents with moderate or severe anxiety symptoms in 2025. SAMHSA, 2025 NSDUH findings
- Substance Abuse and Mental Health Services Administration. (July 27, 2026). Annual National Survey on Drug Use and Health release: treatment among adolescents with a depressive episode in 2025. SAMHSA, 2025 NSDUH findings
- Substance Abuse and Mental Health Services Administration. (July 27, 2026). Annual National Survey on Drug Use and Health release: any mental health treatment among all adolescents in 2025. SAMHSA, 2025 NSDUH findings
- The Trevor Project. (May 6, 2026). 2025 U.S. National Survey on the Mental Health of LGBTQ+ Young People: adolescent symptom results and methods. The Trevor Project, 2025 survey, published May 6, 2026
- Faverio, M., Park, E., & Gottfried, J. (April 15, 2026). Teens’ experiences on TikTok, Instagram and Snapchat. Survey fielded September 25, 2025 to October 9, 2025. Pew Research Center, April 15, 2026
- UCLA Center for Health Policy Research. (September 9, 2025). The Healthy Minds Study: 2024 to 2025 data report, study-author institutional summary. UCLA Center for Health Policy Research, Healthy Minds Study, September 9, 2025
More statistics and related pages
Talk it through with a licensed therapist
If any of this is close to home, a licensed therapist can help you work out what applies to you. Browse license-verified therapists on the internet's original directory.
This page is educational information, not a diagnosis or a substitute for professional care. If you are in crisis, call or text 988 (U.S. Suicide & Crisis Lifeline), any time.