
 By
By Reviewed by
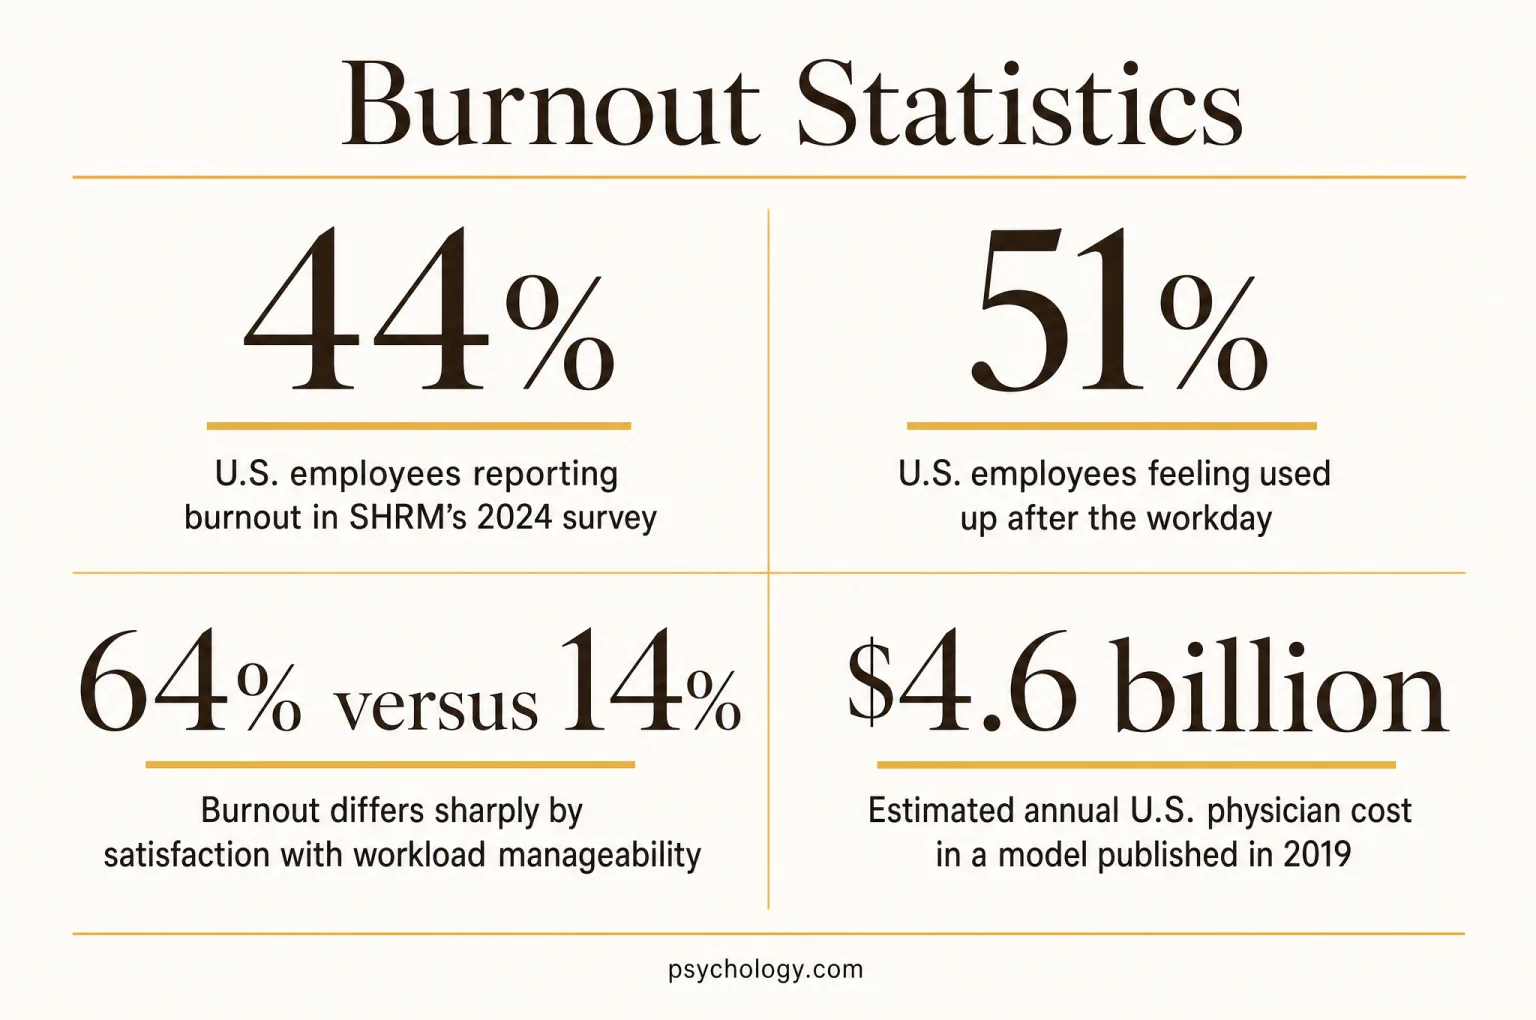
SHRM’s 2024 survey found that 44% of 1,405 U.S. employees felt burned out from work. Other surveys count exhaustion, daily stress or burnout symptoms using different questions. Those figures describe related experiences, but they cannot be combined into a single national burnout rate. The distinction matters when comparing workplaces, professions and years.
Last full review: September 16, 2026 · sourced from Gallup, the American Psychological Association, the American Psychiatric Association, workforce studies and peer-reviewed research.
Ten numbers that define burnout in 2026
- 44% of the 1,405 U.S. employees surveyed for SHRM’s 2024 report felt burned out from work. SHRM, 2024
- 42% of working adults in an American Psychiatric Association poll fielded in April 2024 reported burnout within the previous six months. American Psychiatric Association, 2024
- 22% met the burnout symptom threshold in the McKinsey Health Institute’s April to June 2023 survey of more than 30,000 employees across 30 countries. McKinsey Health Institute, 2023
- 64% versus 14% reported burnout when dissatisfied versus very or extremely satisfied with workload manageability in SHRM’s 2023 sample of 3,845 workers across four countries. SHRM, 2023
- 45% versus 16% were actively seeking another job among workers with versus without burnout in SHRM’s 2024 sample of 1,405 U.S. employees. SHRM, 2024
- 41.9% reported a burnout symptom in the American Medical Association’s 2025 data, based on nearly 19,000 physician responses across 106 participating health systems. American Medical Association, 2026
- 60% of U.S. public K-12 teachers reported burnout in RAND’s January and February 2024 survey of 1,479 teachers. RAND, 2024
- 39.9% of registered nurses in the National Council of State Boards of Nursing’s 2024 workforce study intended to leave nursing or retire within five years. NCSBN, 2025
- 40% of employees globally reported substantial stress the previous day in Gallup’s 2025 data published in 2026, a daily-emotion measure. Gallup, 2026
- 63 million U.S. adults provided ongoing care for an adult or a child with complex medical needs or disability in the past year, according to AARP and the National Alliance for Caregiving’s 2025 report. AARP and National Alliance for Caregiving, 2025
How common burnout is
Burnout surveys agree that a substantial share of working people are struggling, while differing on exactly what they count. U.S. polls often ask people to recognize burnout in themselves. International research may use a scored symptom questionnaire. Frequency, recall period and the survey population all affect the result.
U.S. employees reporting burnout in SHRM’s 2024 survey
SHRM’s 2024 report surveyed 1,405 U.S. employees about how their work felt and found a substantial burden across that sample. This is a self-reported experience rather than a clinical assessment. It is useful as a snapshot of employee strain, especially alongside the same survey’s exhaustion and job-search measures, but it does not establish how long each person had felt this way or which workplace conditions were responsible.
- 42%Burnout during the previous six months, U.S. working adults
The April 9 to April 11, 2024 poll surveyed more than 2,200 U.S. adults; this result concerns its working-adult subgroup, whose size the release does not specify. The six-month recall period can include an episode that had already eased.
American Psychiatric Association: Workplace mental health poll
- 22%Burnout symptoms across the countries in MHI’s 2023 survey
MHI surveyed more than 30,000 employees across 30 countries from April to June 2023. Its threshold was an average score above 3 on a 1-to-5 scale across the four Burnout Assessment Tool dimensions: exhaustion, mental distance, cognitive impairment and emotional impairment.
- 23%Frequent burnout in Gallup’s historical full-time employee study
Gallup’s July 12, 2018 article describes nearly 7,500 full-time employees. Respondents chose very often or always; the article does not disclose when the survey was fielded.
- 44%Sometimes burned out in the same historical Gallup study
This separate response category comes from the same nearly 7,500 full-time employees in Gallup’s July 12, 2018 article. The source gives no field dates, so 2018 identifies publication rather than confirmed data collection.
- 28%Very often or always burned out in Gallup’s 2020 report
This historical benchmark comes from research published in 2020, and its frequency wording makes it more specific than a question about any previous episode.
- 76%At least sometimes burned out in Gallup’s 2020 report
The broader historical total includes less frequent experiences, illustrating how the same survey can produce very different headlines depending on which response categories are included.
| Population and measure | Figure | Meaning and source |
|---|---|---|
| Cameroon respondents with burnout symptoms | 9% | Country subgroup of MHI’s April to June 2023 sample of more than 30,000 employees in 30 countries. McKinsey Health Institute: Reframing employee health |
| India respondents with burnout symptoms | 59% | Country subgroup of the same MHI sample of more than 30,000 employees across 30 countries. McKinsey Health Institute: Reframing employee health |
| All surveyed countries, positive health and low burnout | 49% | MHI’s sample of more than 30,000 employees across 30 countries combined positive health with low burnout symptoms. McKinsey Health Institute: Reframing employee health |
What qualifies as burnout
WHO conceptualizes burnout as a syndrome resulting from chronic workplace stress that has not been successfully managed. It describes three dimensions of occupational burnout: exhaustion, increased distance or cynicism toward one’s job, and diminished professional efficacy. It places burnout among occupational phenomena rather than medical conditions. That definition limits the occupational term to work, while family-care research uses its own related concepts. A survey question about having a stressful day cannot establish that all of these features are present. Equally, a lower symptom-survey percentage should not be read as evidence that everyone below the threshold is doing well.
Country comparisons are sensitive to sampling coverage and cultural response styles. They cannot rank every employer or explain an individual’s experience. Psychology.com’s burnout questionnaire is a separate resource for personal reflection; population percentages do not determine individual results.
What burnout looks like and who it hits
Feeling depleted is the most visible part of burnout, but survey responses also describe changes in motivation, emotional energy and the ability to disengage from work. Differences by age, gender and family responsibilities deserve context. The studies below involve different populations, so their percentages are not a single ranking of vulnerability.
U.S. employees feeling used up after the workday
SHRM’s 2024 survey of 1,405 U.S. employees found that end-of-day depletion reached beyond the group describing itself as burned out. Exhaustion is meaningful in its own right, but it is only part of the occupational burnout picture. The finding also helps explain why a workplace can have a substantial energy problem even when fewer employees choose the word burnout to describe their experience.
- 45%Employees emotionally drained by their work
In SHRM’s 2024 survey of 1,405 U.S. employees, emotional depletion was common, capturing the felt cost of work alongside the more general question about being burned out.
- 36%Women reporting rising stress in Deloitte’s 2025 survey
Deloitte’s 2025 Women @ Work report surveyed 7,500 women in workplaces across 15 countries from October 2024 to January 2025. This measures perceived stress change over a year, rather than a burnout threshold.
- 25%Women taking mental health time off in the preceding year
Among the same 7,500 working women in 15 countries surveyed from October 2024 to January 2025, time off concerned mental health challenges broadly. Deloitte’s 2025 report does not present it as burnout-specific absence.
- 40%Gen Z respondents frequently stressed or anxious, late 2024
Deloitte’s 2025 report surveyed 14,751 Gen Z adults and 8,731 millennials across 44 countries from October 25 to December 24, 2024. The question asked about stress or anxiety all or most of the time; respondents included people outside paid employment.
- 34%Millennial respondents frequently stressed or anxious, late 2024
This figure concerns the 8,731 millennials in Deloitte’s 44-country survey, fielded from October 25 to December 24, 2024 and published in 2025. It uses the same stress-or-anxiety question as the Gen Z comparison.
- 7.9%Parental burnout in a U.S. research sample collected in 2018 to 2019
The unweighted estimate used a Parental Burnout Assessment cutoff of 92 in 406 U.S. parents recruited through convenience and quota methods from March 2018 to September 2019. It should not be treated as national prevalence.
| Population and measure | Figure | Meaning and source |
|---|---|---|
| U.S. workers lacking interest, motivation or energy, 2024 | 29% | APA counted experiences during the previous month. American Psychological Association: Work in America 2024 |
| U.S. workers reporting emotional exhaustion, 2024 | 25% | This symptom alone does not establish the whole burnout syndrome. American Psychological Association: Work in America 2024 |
| Female versus male public school teachers, 2024 | 63% versus 49% | RAND’s January and February 2024 sample included 1,479 public K-12 teachers; both gender groups used the same measure. RAND: Teacher Well-Being and Intentions to Leave in 2024 |
| Financially struggling versus comfortable teachers, 2025 | 52% versus 34% | Gallup’s finding connects financial strain with frequent burnout. Walton Family Foundation-Gallup: Teachers struggle financially |
Interpreting differences between groups
A higher percentage in one group does not identify the reason for the difference. Job assignment, working conditions, caring commitments and the composition of a survey sample can all matter. The teacher comparisons are more informative than comparing a teacher percentage directly with Deloitte’s women’s survey, because the former use a shared question and population. The parental study also examines a distinct domain of life, with its own measurement tool; it cannot be folded into an employee prevalence total. The original parental burnout study describes that separate research framework.
The burnout or depression resource provides background on experiences that can overlap. Population surveys cannot establish whether a particular person’s difficulties are confined to work or extend across daily life.
Workload, control and support
Workload is easier to understand when it includes the time, authority and support available to complete the job. Research repeatedly connects burnout with unfair treatment, unclear expectations and difficult team environments. Most of this evidence is observational, so the strength of an association should remain separate from a claim that an intervention will cause improvement.
Burnout differs sharply by satisfaction with workload manageability
SHRM’s 2023 Global Worker Project surveyed 3,845 workers through an online panel from March 31 to April 17, 2023. It compared people unhappy with how manageable their workload was with those very or extremely satisfied. The contrast concerns the experience of the workload, which includes resources and competing demands, rather than a universal weekly-hours limit. Workers were surveyed across the United States, Canada, Mexico and the United Kingdom, so the result is broader than a U.S.-only estimate.
- 2.3 timesHigher likelihood of burnout with perceived unfair treatment
Gallup’s analysis reported in 2018 linked strongly agreeing about unfair treatment with high burnout, highlighting a relationship that goes beyond the volume of assigned tasks.
- 60%Workers strongly agreeing they knew what was expected
The figure cited in Gallup’s 2018 article describes role clarity, giving context for how uncertainty about priorities can accompany an already demanding job.
- About 70% lowerLower regular burnout likelihood with manager support
Gallup’s historical analysis reported in 2018 found this association among employees strongly agreeing they felt supported, without testing whether a support program would reproduce it.
- 70% lowerLower high-burnout likelihood when there was enough time
In the analysis reported in 2018, employees who often or always had enough time for their work reported less burnout, linking deadlines with perceived capacity.
- 8 timesHigher burnout likelihood with highly toxic workplace behavior
In MHI’s February to April 2022 survey of nearly 15,000 employees across 15 countries, the highest quarter for toxic behavior exposure was compared with the lowest quarter. The association concerns reported symptoms and does not prove causation.
- 62% higherHigher burnout symptom rate with toxic behavior in 2023
MHI’s April to June 2023 survey of more than 30,000 employees across 30 countries found this relative increase. Its percentage increase and the earlier likelihood multiplier come from different analyses and should not be spliced into a trend.
- 54%U.S. workers reporting that job insecurity significantly affected stress, 2025
APA’s Work in America survey asked 2,017 employed adults from March 26 to April 4, 2025. Job insecurity adds a distinct source of pressure alongside workload, although this question does not measure burnout prevalence.
- 47%U.S. workers identifying workload as a workplace stress driver, 2025
SHRM’s unweighted survey of 1,193 workers, fielded from February 7 to February 11, 2025, identified workload among leading stress drivers. This measures perceived working conditions and cannot assign the share of burnout caused by workload.
| Population and measure | Figure | Meaning and source |
|---|---|---|
| Reported workplace harassment | 5.83 | The comparison is with health workers who did not report harassment. Nigam et al., CDC MMWR Quality of Worklife study |
| Trust in management | 0.40 | Values below one indicate lower odds relative to the comparison group. Nigam et al., CDC MMWR Quality of Worklife study |
| Supervisor provides help | 0.26 | The association describes available support in an observational survey. Nigam et al., CDC MMWR Quality of Worklife study |
What the models can explain
In MHI’s 2023 model, job and team factors accounted for 94% of the variance in burnout symptoms that the model explained. This is a share of explained variation, not the percentage of all burnout cases caused by managers. CDC’s odds ratios likewise describe comparisons between groups, rather than the probability that an individual worker will become burned out. Both analyses make working conditions relevant to the discussion, while leaving room for unmeasured influences and differences between workplaces.
Health, turnover and cost
Burnout has costs for the person doing the work and for the organization depending on it. The clearest evidence concerns associations with absence, reduced confidence and plans to change jobs. Economic estimates add a financial perspective, but their assumptions and scope matter as much as the headline dollar amount.
Estimated annual U.S. physician cost in a model published in 2019
Han and colleagues estimated the cost of physician turnover and reduced clinical hours associated with burnout. The calculation used a simulated physician population and inputs from existing research and industry reports. It remains a historical model rather than a current national accounting total, and its scope does not include every possible consequence for patients, families or other healthcare staff.
- $7,600Annual modeled cost per employed physician
The 2019 model translated turnover and reduced clinical hours into an organizational estimate, which is a benchmark for that analysis rather than a bill attached to each physician.
- 0.5 to 2 times salaryGeneral employee replacement cost relative to annual salary
Gallup’s estimate published in 2019 covers employee turnover overall, so multiplying it by a burnout percentage would not produce a defensible burnout cost total.
Gallup: This fixable problem costs U.S. businesses $1 trillion
- 63% higherHigher likelihood of taking a sick day
Gallup’s research published in 2020 found more sickness absence among employees experiencing frequent burnout, an association that does not assign the cause of each absence.
- 23% higherHigher likelihood of visiting an emergency room
This association in Gallup’s research published in 2020 concerns healthcare use and should not be read as evidence that burnout caused every reported emergency visit.
- 2.6 timesHigher likelihood of actively seeking another job
The Gallup report published in 2020 measured job-search behavior, which may precede a departure but is not a record of people actually leaving.
- 6 timesHigher likelihood of intending to leave within three to six months
In MHI’s February to April 2022 survey of nearly 15,000 employees across 15 countries, respondents with burnout symptoms more often intended to leave their employer within three to six months. This measures plans, whose eventual outcome remains uncertain.
| Population and measure | Figure | Meaning and source |
|---|---|---|
| Actively searching for a job, burnout versus no burnout, 2024 | 45% versus 16% | In its 2024 sample of 1,405 U.S. employees, SHRM measured current job-search activity. SHRM: Employee Mental Health in 2024 |
| Going beyond expectations, burnout versus no burnout, 2024 | 40% versus 56% | In its 2024 sample of 1,405 U.S. employees, SHRM measured employees’ reported extra effort. SHRM: Employee Mental Health in 2024 |
| Confidence in performance, historical Gallup study reported in 2018 | 13% lower | The association concerns confidence rather than independently assessed output. Gallup: Employee Burnout, Part 1 |
Reading cost estimates without overstating them
The physician economic model focuses on costs that could be expressed through turnover and working hours. Its authors acknowledge uncertainty in source studies and parameters that required extrapolation. The resulting estimate cannot simply be adjusted by the latest burnout prevalence, because salaries, staffing, career decisions and the structure of care may also have changed. Likewise, a person intending to leave may stay, change hours or move within an organization. Financial estimates and employee intentions answer different questions, even when both point toward a costly staffing problem.
Workplace mental health and what employers do
Knowing that support exists and feeling able to use it are separate experiences. Workplace surveys ask about access, confidence in employers and the ability to switch off. These findings describe how support is experienced by employees, while leaving open whether a particular benefit is accessible, suitable or effective for an individual.
Working adults knew how to access mental health care through work
The American Psychiatric Association’s April 9 to April 11, 2024 poll of more than 2,200 U.S. adults found, among its working-adult subgroup, that awareness of access was widespread, alongside concerns about the consequences of seeking help. This measures employees’ knowledge of available routes. It does not show how many tried to use them, obtained an appointment or found the service useful, which would require additional questions and follow-up.
American Psychiatric Association: Workplace mental health poll
- 44%Worried about retaliation or dismissal for mental health time off
In the American Psychiatric Association’s 2024 poll, anticipated workplace consequences formed a potential barrier even when an employee knew where support was available.
American Psychiatric Association: Workplace mental health poll
- 39%Worried about retaliation or dismissal for seeking care
The same 2024 poll asked separately about accessing mental health care, showing that a benefit can coexist with concerns about how using it will be perceived.
American Psychiatric Association: Workplace mental health poll
- 48%Struggled to get away from work at the end of the day
The American Psychiatric Association’s 2024 figure combines always and sometimes responses, describing difficulties with separation rather than a burnout diagnosis.
American Psychiatric Association: Workplace mental health poll
- 54%Hourly full-time workers satisfied with work-life flexibility
SHRM’s March 31 to April 17, 2023 online survey included 3,845 workers across the U.S., UK, Canada and Mexico. This percentage concerns the full-time hourly subgroup, whose size is not stated in the summary, and combines very and extremely satisfied responses.
- 15%Workers describing a toxic workplace in 2024
The American Psychological Association’s Work in America report measures employees’ description of their environment, rather than an external assessment of each employer.
- 59%Workers saying their employer overestimated workplace mental health
APA’s 2024 survey found a substantial perception gap, making employee feedback relevant even when leadership believes the environment is supportive.
- 30%U.S. workers willing to take a pay cut for better mental health support, 2025
SHRM’s February 2025 worker survey measured a hypothetical tradeoff rather than an observed pay decision. The finding indicates the value respondents attached to workplace support without establishing whether a particular benefit would improve their health.
| Population and measure | Figure | Meaning and source |
|---|---|---|
| Workers worried about disclosing a mental health condition, 2024 | 39% | APA measured concern about a negative workplace impact. American Psychological Association: Work in America 2024 |
| Positive overall health and low burnout symptoms, 2023 | 49% | MHI combined health and symptoms in more than 30,000 employees surveyed across 30 countries from April to June 2023. McKinsey Health Institute: Reframing employee health |
| Engaged fully remote employees worldwide, 2024 | 31% | Gallup’s engagement measure concerns connection to work. Gallup: The Remote Work Paradox |
The stress management resource and personal wellness and crisis plan sit alongside this workplace evidence. Personal resources and employer conditions address different parts of daily life. The survey figures do not establish that offering a tool, adding a benefit or changing a work location will by itself produce a particular reduction in burnout.
For people seeking professional support, Psychology.com’s directory can help locate a licensed therapist. Access to an employer benefit, awareness of that benefit and actually obtaining care are separate steps, so none of the access percentages above establishes that an employee received timely support.
Trends 2019 to 2026
The pandemic disrupted work across professions, but the subsequent trends have not all moved together. Global daily stress has eased from its peak, physician burnout has declined in two major series, and engagement has fallen. Reports published in 2026 often describe experiences measured in earlier years, making the measurement date essential to interpreting a trend.
Global employees reporting substantial daily stress in 2025
Gallup’s 2026 report asks whether employees experienced a lot of stress during the preceding day. Its global series allows a comparison over time using a consistent daily-emotion question. The measure covers stress from any source and does not identify how much was caused by work, or how many respondents also had sustained occupational burnout.
- 38%Daily stress before the pandemic, 2019
This global employee baseline is useful because it predates the disruption of work and ordinary life that began the following year.
- 43%Global daily stress in 2020
The rise coincided with the pandemic’s first year, although the survey cannot separate the contributions of health concerns, home life and employment.
- 44%Global daily stress in 2021
The high share describes the emotional experience of employees during that year, without establishing that every stressed respondent had burnout.
- 44%Global daily stress in 2022
The headline rate remained at the same level as the preceding year, before falling in subsequent survey waves.
- 41%Global daily stress in 2023
Gallup’s 2024 report recorded a lower share than the preceding peaks, while stress remained above the pre-pandemic figure shown here.
- 40%Global daily stress in 2024
The 2025 report continued the decline in daily stress, a direction that should be distinguished from changes in employee engagement.
| Population and measure | Figure | Meaning and source |
|---|---|---|
| National physician survey, 2020 | 38.2% | Shanafelt and colleagues report this earlier benchmark. Shanafelt et al., Mayo Clinic Proceedings |
| National physician survey, 2021 | 62.8% | The pandemic-era wave showed a sharp increase. Shanafelt et al., Mayo Clinic Proceedings |
| National physician survey, 2023 wave | 45.2% | The later wave showed substantial improvement. Shanafelt et al., Mayo Clinic Proceedings |
| AMA participating health systems, 2023 | 48.2% | This begins a separate organizational comparison series. AMA: Physician burnout rates are falling |
| AMA participating health systems, 2024 | 43.2% | Burnout symptoms declined within that series. AMA: Physician burnout rates are falling |
| AMA participating health systems, 2025 | 41.9% | The 2025 snapshot included nearly 19,000 physician responses across 106 participating health systems in 38 states. AMA: Physician burnout rates are falling |
| Population and measure | Figure | Meaning and source |
|---|---|---|
| Employees classified as engaged, 2023 | 23% | Engagement concerns involvement and enthusiasm for work. Gallup: State of the Global Workplace 2024 |
| Employees classified as engaged, 2024 | 21% | The global engagement percentage fell. Gallup: State of the Global Workplace 2025 |
| Employees classified as engaged, 2025 | 20% | The 2026 release recorded a further decline. Gallup: State of the Global Workplace 2026, global data |
Why a 2026 page includes earlier measurement years
A report’s publication year can follow data collection by months or longer. The physician study’s 2023 wave was fielded across late 2023 and early 2024, then published in 2025. Its sampling and measurement differ from the AMA’s participating-health-system series, so the two should retain separate labels. Similarly, lower daily stress alongside lower engagement is possible because they measure different experiences. These releases do not establish a completed full-year burnout rate for 2026.
Healthcare, teaching and caregiving
Work that involves responsibility for other people brings burnout into hospitals, classrooms and homes. The studies use different populations and instruments, so the percentages need to stay attached to their source. Nursing workforce departures, teacher burnout and family caregiver strain each reveal a different part of the pressure surrounding care.
U.S. public school teachers reporting burnout in early 2024
RAND’s State of the American Teacher survey included 1,479 public K-12 teachers in January and February 2024, with results weighted to the national teacher population. The report also measured frequent work stress, allowing those experiences to be considered separately. A teacher can remain in the classroom while feeling depleted, so a stable workforce count would not, by itself, show that the people staying are doing well.
- 45.6%Health workers often or very often burned out in 2022
CDC’s Quality of Worklife analysis covered health workers broadly, so its estimate should not be substituted for the narrower physician figures.
- 45.1%Nurses frequently burned out in the 2022 workforce study
NCSBN reported this share feeling burned out a few times a week or every day, providing an explicitly historical view of pandemic-era strain.
- 39.9%Registered nurses intending to leave or retire within five years
The 2024 workforce study measured future plans through 2029, combining career departures and retirement rather than isolating burnout-driven exits.
- 41.3%Practical and vocational nurses intending to leave or retire
NCSBN’s 2024 study reported a separate estimate for this nursing workforce, whose roles and career circumstances differ from those of registered nurses.
- 59%Teachers with frequent job-related stress in early 2024
RAND surveyed 1,479 public K-12 teachers in January and February 2024 and measured stress separately from burnout. The two weighted percentages describe overlapping experiences rather than groups that can be added together.
- 52%Teachers very often or always burned out in Gallup’s 2022 survey
This historical finding uses a different question and survey from RAND’s 2024 estimate, preventing a simple claim about how much teacher burnout rose.
| Population and measure | Figure | Meaning and source |
|---|---|---|
| Pandemic-era registered nurse departures, 2022 study | About 100,000 | Reported reasons included stress, burnout and retirement. NCSBN: Nursing workforce shortages and crisis |
| One component of the RN intention-to-leave projection by 2027 | 610,388 | This 2022-study estimate covers one component of projected departures for stress, burnout and retirement. The release separately reports additional younger RNs intending to leave, so this is only part of the total. NCSBN: Nursing workforce shortages and crisis |
| Nurse departures since 2022, measured in 2024 | More than 138,000 | The later estimate again reflects several reasons for leaving. NCSBN: Small steps toward nursing workforce recovery |
| Population and measure | Figure | Meaning and source |
|---|---|---|
| Adults caring for an adult or a child with complex needs in the past year | 63 million | The 2025 report surveyed 6,858 caregivers aged 18 or older. This population estimate describes the scale of caregiving responsibilities. AARP and National Alliance for Caregiving: Caregiving in the U.S. 2025 |
| Caregivers reporting fair or poor health | 1 in 5 | This is a general health rating. AARP and National Alliance for Caregiving: Caregiving in the U.S. 2025 |
| Caregivers reporting social isolation | Nearly 1 in 4 | This measures connection with other people rather than occupational burnout. AARP and National Alliance for Caregiving: Caregiving in the U.S. 2025 |
Caregiving strain has its own research context
Family care may sit alongside paid employment, but the caregiving report does not apply an occupational burnout diagnostic standard to everyone it counts. It includes care for adults and children with complex needs, and the newer report also includes family caregivers receiving compensation. The figures therefore should not be described as a count of unpaid caregivers with burnout. Similarly, nursing departures attributed to stress, burnout and retirement cannot establish how many nurses left solely because of burnout. The source categories preserve those limits while making the scale of responsibility visible.
Common questions
How common is burnout among workers?
There is no single directly comparable rate. SHRM found 44% of its 1,405 surveyed U.S. employees felt burned out in its 2024 report, while an American Psychiatric Association poll found 42% of working adults reported burnout within the previous six months. MHI’s April to June 2023 survey of more than 30,000 employees across 30 countries found 22% above its symptom threshold. Different questions, time windows and samples explain why these figures should remain separate. SHRM and the psychiatric association poll provide the original U.S. findings.
Is burnout a medical diagnosis?
WHO classifies burnout as an occupational phenomenon in ICD-11 resulting from chronic workplace stress that has not been successfully managed, with exhaustion, job-related distance or cynicism, and reduced professional efficacy as its defining dimensions. It does not classify burnout itself as a medical condition. Surveys may use a shorter self-description or a symptom scale, so a survey percentage is not a count of clinical diagnoses. Parental burnout research examines a related experience in family life using separate instruments. WHO’s classification explanation sets out the occupational scope.
Does remote work reduce burnout?
The evidence here does not establish a universal effect. Gallup’s 2025 global data showed daily stress among 41% of fully remote employees and 46% of hybrid employees, compared with 46% of on-site employees in remote-capable jobs and 39% in jobs that could not be remote. Those groups already differed in their jobs and circumstances. Daily stress is also a different measure from sustained burnout. Gallup’s analysis describes these associations rather than testing a change of location.
Is physician burnout getting better?
Recent major surveys show improvement within their own series. The AMA’s participating-health-system data fell from 48.2% in 2023 to 43.2% in 2024 and 41.9% in 2025. A separate national physician study reported 62.8% in 2021 and 45.2% in its 2023 wave. These are encouraging directions, though differences in sampling prevent treating them as one continuous series. AMA’s release explains the latest organizational snapshot and its participating population.
How much does burnout cost employers?
A model published in 2019 estimated $4.6 billion annually in U.S. physician turnover and reduced clinical hours attributable to burnout, or about $7,600 per employed physician at the organizational level. Those are historical model estimates with a defined scope. They should not be presented as the cost of burnout across all industries or as current employer spending. Job-search percentages are likewise different from actual departures. Han and colleagues’ study describes the calculation and its limitations.
Can burnout statistics tell whether someone is at risk of self-harm?
A workplace burnout percentage cannot determine an individual’s safety or explain why someone might have thoughts of self-harm. Burnout surveys measure work experiences and symptoms across groups, while personal risk requires attention to the person’s circumstances. Occupational strain can be deeply distressing even when it falls outside a survey cutoff. If you or someone you know is thinking about suicide or is in crisis, call or text 988 in the United States to reach the Suicide and Crisis Lifeline.
How we compiled this
Figures were checked against original survey reports, research abstracts, official workforce releases and the WHO definition. The American Psychological Association’s report supplies U.S. employee findings on psychological safety and workplace mental health. Survey responses, symptom thresholds, daily stress and caregiver strain are kept separate. Publication dates are distinguished from measurement years, and older studies retain their historical labels. Corporate surveys and economic models are attributed to their issuers. Associations are described without assuming causation, and intentions to leave are distinguished from recorded departures. Sources that could not be retrieved or did not display the quoted number were excluded. SHRM’s 2024 report covered 1,405 U.S. employees; its 2023 Global Worker Project covered 3,845 workers across four countries. Deloitte’s Women @ Work 2025 report surveyed 7,500 working women in 15 countries from October 2024 to January 2025; its Gen Z and millennial report used 23,482 responses collected in late 2024 across 44 countries. The American Psychological Association’s Work in America survey included 2,027 employed U.S. adults, fielded from March 25 to April 3, 2024. The American Psychiatric Association poll used a broader adult sample and reported these workplace findings for working adults. RAND’s teacher survey was fielded in January and February 2024. Gallup’s historical 2018 and 2020 article dates identify publication; those articles do not state survey field dates. The figures illustrate their named populations and measures, and historical benchmarks do not establish current prevalence. The September 16, 2026 refresh checked APA’s Work in America 2025 survey, SHRM’s May 7, 2025 workplace release and Gallup’s State of the Global Workplace 2026 tables. APA’s newer survey covered 2,017 employed adults from March 26 to April 4, 2025. SHRM’s newer worker sample covered 1,193 employees from February 7 to February 11, 2025 and was unweighted. The newer stress and support questions supplement the earlier burnout measures; they do not replace them with a different outcome. Daily stress by work arrangement now uses Gallup’s 2025 observations, while the separately labeled historical remote-work engagement figure retains its original year. Last full review: September 16, 2026.
Journalists and researchers may reuse any statistic with attribution to the original source and a link to Psychology.com.
Cite this source
Fontane Pennock, S. (2026, September 13). Burnout Statistics 2026. Psychology.com. https://psychology.com/burnout-statistics/
References
- SHRM. (2024). Here’s how bad burnout has become at work. Employee Mental Health in 2024 Research Series. www.shrm.org
- American Psychiatric Association. (May 22, 2024). New polling data shows most employers offer some form of mental health benefits, but burnout impacts over 40% of employees. www.psychiatry.org
- Brassey, J., Herbig, B., Jeffery, B., & Ungerman, D. (November 2, 2023). Reframing employee health: Moving beyond burnout to holistic health. McKinsey Health Institute. www.mckinsey.com
- Wigert, B., & Agrawal, S. (July 12, 2018). Employee burnout, part 1: The 5 main causes. Gallup. www.gallup.com
- Wigert, B. (March 13, 2020). Employee burnout: The biggest myth. Gallup. www.gallup.com
- World Health Organization. (n.d.). Burn-out an occupational phenomenon. ICD-11 classification FAQ. www.who.int
- Deloitte. (2025). Women @ Work 2025: A global outlook. www.deloitte.com Original report and methodology.
- Deloitte. (2025). 2025 Gen Z and millennial survey. www2.deloitte.com
- Roskam, I., et al. (2021). Parental burnout around the globe: A 42-country study. Affective Science, 2, 58-79. pmc.ncbi.nlm.nih.gov
- SHRM. (2023). What global workers want: Global Worker Project research highlights. www.shrm.org
- Brassey, J., et al. (May 27, 2022). Addressing employee burnout: Are you solving the right problem? McKinsey Health Institute. www.mckinsey.com
- Nigam, J. A. S., et al. (2023). Vital signs: Health worker-perceived working conditions and symptoms of poor mental health, Quality of Worklife Survey, United States, 2018 to 2022. MMWR, 72, 1197-1205. www.cdc.gov
- Han, S., et al. (2019). Estimating the attributable cost of physician burnout in the United States. Annals of Internal Medicine, 170, 784-790. pubmed.ncbi.nlm.nih.gov
- McFeely, S., & Wigert, B. (March 13, 2019). This fixable problem costs U.S. businesses $1 trillion. Gallup. www.gallup.com
- American Psychological Association. (2024). 2024 Work in America survey: Psychological safety in the changing workplace. Original report. www.apa.org
- Gallup. (May 7, 2025). The remote work paradox: Higher engagement, lower wellbeing. www.gallup.com
- Gallup. (2026). State of the Global Workplace: 2026 global data summary. Data collected in 2025. www.gallup.com
- Gallup. (2024). State of the Global Workplace: 2024 report. Data collected in 2023. www.gallup.com
- Gallup. (2025). State of the Global Workplace: 2025 report. Data collected in 2024. www.gallup.com
- Shanafelt, T. D., et al. (2025). Changes in burnout and satisfaction with work-life integration in physicians and the general US working population between 2011 and 2023. Mayo Clinic Proceedings, 100, 1142-1158. pubmed.ncbi.nlm.nih.gov
- American Medical Association. (April 16, 2026). Physician burnout rates are falling, specialty gaps remain. 2025 national physician comparison data. www.ama-assn.org
- Doan, S., Steiner, E. D., & Pandey, R. (2024). Teacher well-being and intentions to leave in 2024: Findings from the 2024 State of the American Teacher Survey. RAND, RR-A1108-12. www.rand.org
- Marken, S., & Agrawal, S. (June 13, 2022). K-12 workers have highest burnout rate in U.S. Gallup. news.gallup.com
- Gallup. (March 1, 2026). One in five K-12 teachers struggle financially. Walton Family Foundation-Gallup survey conducted in 2025. news.gallup.com
- National Council of State Boards of Nursing. (2023). NCSBN research projects significant nursing workforce shortages and crisis. Findings from the 2022 workforce study. www.ncsbn.org
- National Council of State Boards of Nursing. (2025). NCSBN research highlights small steps toward nursing workforce recovery; burnout and staffing challenges persist. Findings from the 2024 workforce study. www.ncsbn.org
- AARP & National Alliance for Caregiving. (July 24, 2025). New report reveals crisis point for America’s 63 million family caregivers. Caregiving in the U.S. 2025. www.aarp.org
- American Psychological Association. (2025). Highlights from the 2025 Work in America survey. www.apa.org
- SHRM. (May 7, 2025). Poor leadership, heavy workloads top contributors for workplace burnout, new SHRM research finds. www.shrm.org
More statistics and related pages
Talk it through with a licensed therapist
If work strain or caregiving pressure is affecting your life, Psychology.com’s directory can help you find a licensed therapist to talk with about your circumstances.
This page is educational information, not a diagnosis or a substitute for professional care. If you are in crisis, call or text 988 (U.S. Suicide & Crisis Lifeline), any time.