
 By
By Reviewed by
Final NCHS mortality data count 48,824 U.S. suicide deaths in 2024, with an age-adjusted rate of 13.7 per 100,000. SAMHSA’s newer 2025 survey estimates 13.9 million adults experienced serious suicidal thoughts in the past year. These are separate measures from different populations and reporting systems. The sections below retain dated historical comparisons, identify newer survey findings and pair descriptions of risk with research on prevention, support and access to care.
Last full review: September 16, 2026 · sourced from CDC and NCHS mortality data, SAMHSA, the VA, WHO and peer-reviewed research.
Ten numbers that define suicide in 2026
- Final NCHS mortality data record 48,824 U.S. suicide deaths in 2024, an age-adjusted rate of 13.7 per 100,000, down 2.8% from 2023. Source NCHS Data Brief 548, January 2026
- NCHS reports suicide was the 10th leading cause of death in 2024 as the ranking of other causes also changed. Source NCHS Data Brief 548, January 2026
- SAMHSA’s 2025 NSDUH estimates 13.9 million U.S. adults reported serious suicidal thoughts, 4.9 million reported a plan and 2.3 million reported an attempt in the past year, with overlapping groups. SAMHSA, 2025 NSDUH findings SAMHSA, 2025 NSDUH, released 2026
- AFSP reports that the male suicide rate in 2024 was nearly four times the female rate, a gap that has held at three to four times for two decades. Source AFSP, 2024 data; NCHS, 2002 to 2022 series
- CDC reports that non-Hispanic American Indian and Alaska Native people had the highest age-adjusted rate among racial and ethnic groups in 2022, at 27.1 per 100,000, against 14.2 overall. Source CDC MMWR, September 19, 2024 (2022 data)
- CDC’s 2023 YRBS found 20.4% of U.S. high school students seriously considered suicide in 2023 and 9.5% made an attempt; both figures are higher than in 2013. Source CDC YRBS, 2023
- The VA’s 2025 annual report records 6,398 veterans died by suicide in 2023, about 17.5 a day; after age adjustment, the male veteran rate was 49.7% above male non-veterans and the female rate 103.1% above. Source VA Annual Report, 2025
- WHO estimates that globally 727,000 people died by suicide in 2021, 1.1% of all deaths, and 73% of them in low- and middle-income countries. Source WHO, 2025
- Stanley and colleagues’ 2018 cohort comparison found that a safety plan plus follow-up calls was associated with 45% fewer suicidal behaviors over six months in a study of 1,640 patients at nine VA emergency departments without random assignment. Source Stanley et al., JAMA Psychiatry, 2018 (2010 to 2015 data)
- The national Suicide and Crisis Lifeline received 23.3 million calls, texts and chats from July 2022 through March 2026, according to KFF, with monthly volume above 600,000 over the preceding year, with contacts including repeat use. Source KFF, July 14, 2026
How many lives are lost to suicide
U.S. suicide mortality statistics come from death certificates compiled by the National Center for Health Statistics. The 2024 data are final and show a small decline in deaths and the age-adjusted rate from 2023. Final files provide a firmer basis for comparisons than early provisional releases, although classification and population estimates still affect the results.
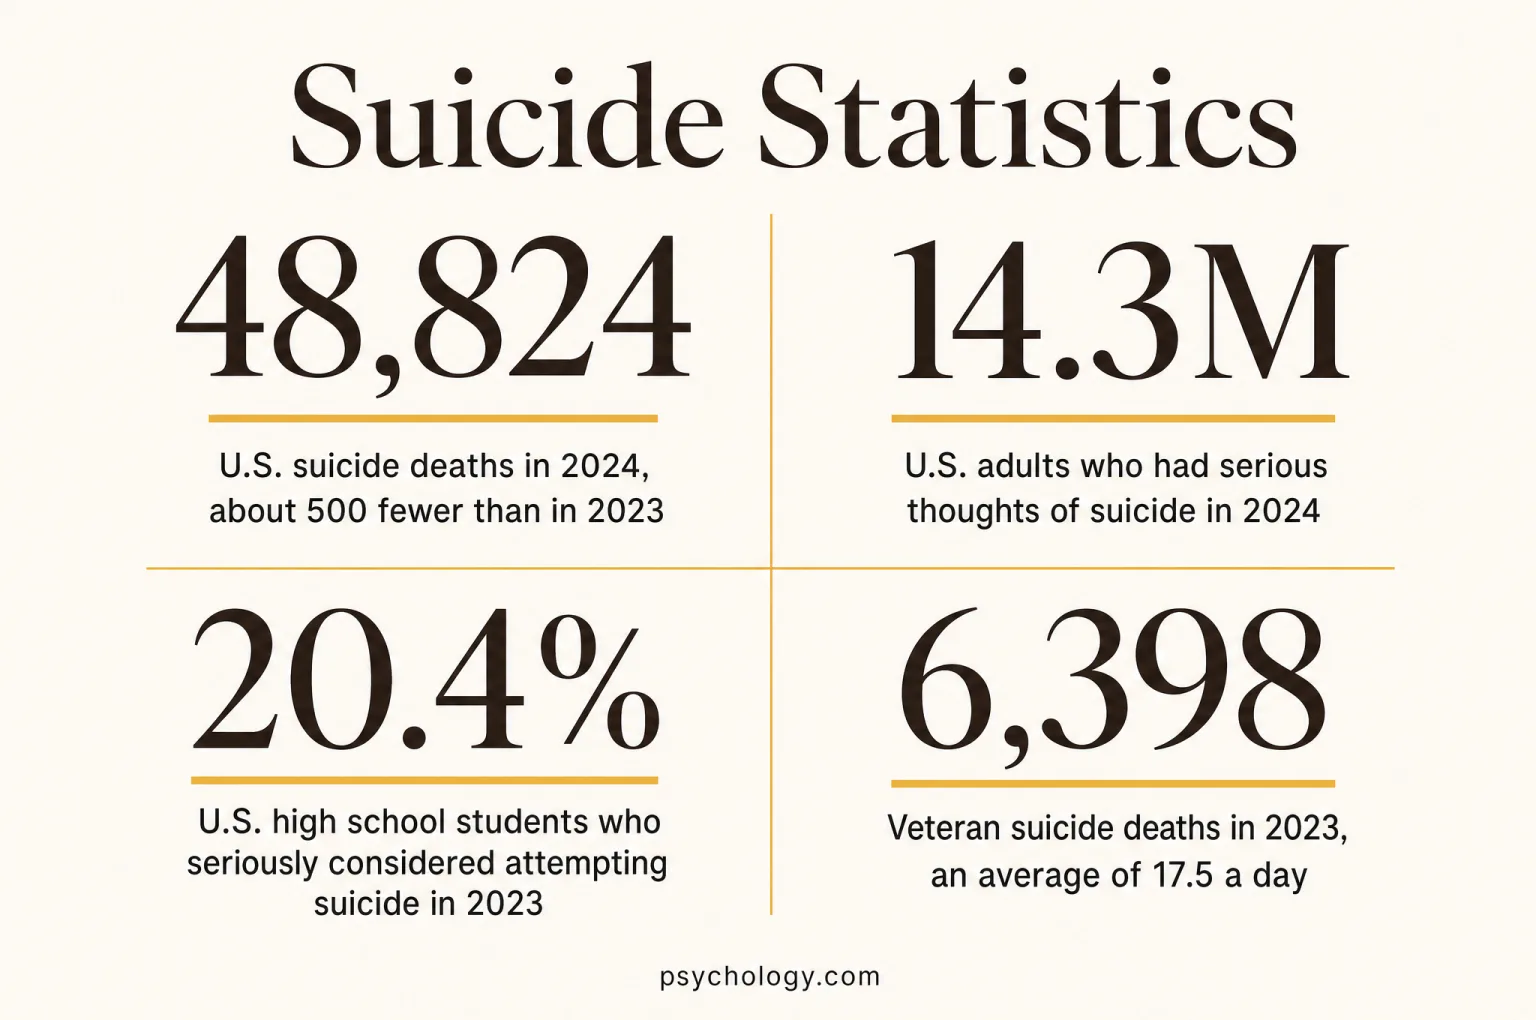
U.S. suicide deaths in 2024, about 500 fewer than in 2023
The age-adjusted rate fell 2.8%, from 14.1 to 13.7 per 100,000. That is the lowest rate since 2020 (13.5), while remaining above the 2002 rate (10.9) reported in NCHS Data Brief 509. These figures come from final mortality data published in January 2026.
NCHS Data Brief 548, January 2026 · CDC Suicide Data and Statistics · NCHS Data Brief 509 · NCHS Data Brief 464
- 10thSuicide's rank among U.S. causes of death in 2024
Final NCHS data place suicide 10th in 2024, after ranking 11th in 2023. A cause-of-death rank depends on deaths from other causes as well as deaths from suicide.
- 49,316Suicide deaths in 2023; age-adjusted rate of 14.1 per 100,000
The 2023 count was slightly below 2022 (49,476) and the rate was statistically unchanged from 2018 (14.2), the modern peak year.
- 14.4Crude death rate per 100,000 in 2024, before age adjustment
The crude rate divides deaths by population; the age-adjusted rate (13.7) is used for year-to-year and state comparisons because it removes shifts in the age mix.
- 616,000Emergency department visits for self-harm injury in 2022
This estimate counts visits, so a person can be counted more than once. Self-harm injury includes injuries with differing intent and should not be treated as a count of suicide attempts or individual patients.
- $510BEstimated average annual U.S. economic cost of suicide and ED-treated self-harm, 2015 to 2020
In 2020 U.S. dollars, CDC researchers estimated $484 billion annually for suicide, 95% of the $510 billion total, largely reflecting the value of life years lost. Adults aged 25 to 64 accounted for $356 billion of the suicide estimate; the total represents an economic valuation rather than health care spending.
- 2ndRank as a cause of death for ages 10 to 14, 15 to 24 and 25 to 44 in 2023
NCHS ranks suicide second in these three specific age bands. Rankings can differ when age bands are split more narrowly; the broad 25 to 44 category does not establish the rank separately for ages 35 to 44.
Final versus provisional data
NCHS publishes provisional mortality data before completing its final annual files. The 2024 figures used here are final, published in January 2026. This page uses final data through 2024 for its U.S. mortality trend, keeping the same status across the displayed years. Provisional estimates can change as death certificates are processed and causes are resolved.
Who is most affected
Suicide rates differ across demographic groups and places. In the data below, rates are elevated among older men, non-Hispanic American Indian and Alaska Native people, and rural residents. These population patterns can help guide prevention resources, but they cannot predict an individual outcome. Access to care, social support and community conditions all deserve attention.
Age-adjusted suicide rate per 100,000 among non-Hispanic American Indian and Alaska Native people in 2022
That is nearly double the national rate of 14.2 and the highest of any racial or ethnic group. In 2023, AI/AN non-Hispanic males had an age-adjusted rate of 35.3 per 100,000 and AI/AN females 12.4, both the highest for their sex. The CDC's 2024 data again list AI/AN and non-Hispanic White people as the two groups with the highest rates.
- ~4xMale rate compared with the female rate in 2024
AFSP reports 38,977 male and 9,847 female suicide deaths in 2024. CDC describes the male suicide rate as nearly four times the female rate that year. In NCHS’s historical 2002 to 2022 age-adjusted series, male rates were around three to four times female rates.
- 85+Age group with the highest suicide rate in AFSP’s 2024 summary
AFSP reports 21.4 deaths per 100,000 among people aged 85 and older in 2024. Using different age bands, NCHS reports that males aged 75 and older had the highest male age-specific rate in 2023, at 40.7 per 100,000.
- 20.0 vs 13.4Age-adjusted rural and urban suicide rates per 100,000 in 2022
Rural residents died by suicide at roughly 1.5 times the urban rate. Counties in the top third for health insurance coverage, broadband access and household income all had markedly lower rates.
- 8.6Rate per 100,000 among women aged 45 to 64 in 2023, the highest female age group
Women's rates peak in midlife rather than old age, the opposite of the male pattern.
- 35.3 / 12.4Age-adjusted rates for non-Hispanic AI/AN males and females in 2023
NIMH reports the highest rates for both sexes in the non-Hispanic American Indian and Alaska Native population. The corresponding non-Hispanic White rates were 28.0 for males and 7.4 for females. Race and ethnicity definitions must match before comparing these estimates.
- 28.2Alaska’s age-adjusted suicide rate per 100,000 in 2023, highest among states
Final CDC data list Montana at 26.6, Wyoming at 26.3, Idaho at 23.3 and New Mexico at 22.8. New Jersey had the lowest state rate (7.2), followed by New York (8.3). The District of Columbia, reported separately from states, was 5.7. All figures use age adjustment.
Why county conditions matter
In the same CDC analysis of 2022 deaths, the age-adjusted rates in counties in the highest third for health insurance coverage, broadband access and household income were 13.0, 13.3 and 13.5 per 100,000, respectively. Each was below the rate in the corresponding lowest third. These are county-level associations and cannot show that changing one factor alone would cause a specific reduction. Improving access and support is part of a broader prevention approach. Source: CDC MMWR, September 19, 2024.
Suicidal thoughts and attempts
The National Survey on Drug Use and Health estimates serious suicidal thoughts, plans and attempts among U.S. civilian, noninstitutionalized adults. These are self-reported experiences in the previous year. The estimates describe people rather than the number of episodes, and the categories overlap. They should be read separately from death-certificate counts, which cover a different population. The newer 2025 estimates below extend the survey coverage while the 2024 displays retain their original dates; neither series predicts an individual’s risk.
U.S. adults who had serious thoughts of suicide in 2024
In the 2024 NSDUH, 5.5% of civilian, noninstitutionalized adults aged 18 and older reported serious thoughts of suicide during the past year. An estimated 4.6 million adults reported a plan and 2.2 million (0.8%) reported an attempt. Serious thoughts were most common among adults aged 18 to 25, at 12.6%. These categories overlap and do not describe an inevitable progression.
- 2.2MAdults who attempted suicide in the past year, 2024
The attempt rate was 0.8% of adults overall and 2.0% among 18- to 25-year-olds, the highest of any adult age band.
- 4.6MAdults who made a suicide plan in 2024
The estimate covers civilian, noninstitutionalized adults aged 18 and older reporting a plan during the past year. Thoughts, plans and attempts are overlapping survey categories; an attempt can also occur without a reported plan.
- 83%People in an eight-system study who had a health care visit in the year before suicide, 2000 to 2010
Among 5,894 people enrolled in the participating health plans, 83% used health services in the preceding year and about 45% had a recorded mental health diagnosis. Nearly half had a visit in the preceding four weeks. This study, published in 2014, describes opportunities for prevention within health care rather than all U.S. suicide deaths.
- 616,000Emergency department visits for self-harm injury in 2022
The CDC estimate counts self-harm injury visits rather than unique patients or confirmed suicide attempts. Emergency care can provide an opportunity to identify support needs and connect patients with follow-up care.
- $26BEstimated annual U.S. cost of ED-treated nonfatal self-harm, 2015 to 2020
In 2020 U.S. dollars, people aged 10 to 44 accounted for about $19 billion of the $26 billion estimate. The study includes medical costs, lost work and reduced quality of life; the total does not represent medical spending alone.
- 13.9 millionAdults reporting serious suicidal thoughts in 2025
SAMHSA reports that 5.3% of adults ages 18 and older experienced serious thoughts of suicide in the past year in 2025; this self-reported population estimate is distinct from mortality and crisis-service contact counts.
- 4.9 million / 2.3 millionAdults reporting a suicide plan or attempt in 2025
In the 2025 NSDUH, 1.8% of adults reported a past-year plan and 0.9% reported an attempt; the corresponding groups overlap and cannot be added into a count of unique people.
Thoughts, plans, attempts and deaths in 2024
The 2024 estimates are 14.3 million adults with serious thoughts, 4.6 million with a plan and 2.2 million who attempted suicide. These overlapping groups come from a survey of living respondents. The 48,824 deaths are counted separately through death certificates across all ages. Dividing the death count by the survey estimates would not measure a person’s probability of dying or a transition from thoughts to action. Support and follow-up remain relevant at every stage.
Serious thoughts of suicide often accompany depression, and a depression screening can help a reader put words to persistent sadness or hopelessness before raising it with a doctor or therapist.
Youth and young adults
Suicide ranked second as a cause of death for Americans aged 10 to 34 in NIMH’s summary of 2023 data. The CDC’s high school survey found that suicidal thoughts and attempts increased over 2013 to 2023. The overall percentages were numerically lower in 2023 than in 2021, but those two-year changes were not statistically significant. School connection and supportive environments are associated with lower risk.
U.S. high school students who seriously considered attempting suicide in 2023
About one in five students reported serious thoughts during the past year. In the same 2023 survey, approximately 16% reported a plan, 9.5% an attempt and 2% an attempt requiring medical treatment. Female students reported serious thoughts at 27.1%, compared with 14.1% for male students; reported attempts were 12.6% and 6.4%, respectively. The survey records reports from students in grades 9 to 12 and does not establish clinical diagnoses.
CDC YRBS 2023, MMWR Supplement · CDC YRBS Trends Report, 2013 to 2023
- 41.0%LGBQ+ high school students who seriously considered suicide in 2023
The corresponding estimate was 13.0% among heterosexual students. Past-year attempts were reported by 19.7% of LGBQ+ students and 6.0% of heterosexual students. This analysis groups students by sexual identity; its LGBQ+ category should not be substituted for a combined sexual and gender identity category.
- 52.9%Transgender high school students who seriously considered suicide in 2023
About a quarter (25.9%) reported an attempt, compared with 5.3% of cisgender boys and 11.0% of cisgender girls. The weighted estimate was that 3.3% of U.S. high school students identified as transgender.
- 36%LGBTQ+ respondents aged 13 to 24 reporting serious thoughts in the Trevor Project’s 2025 survey
In this online sample of 16,667 respondents, 36% reported past-year serious thoughts and about one in ten reported an attempt. Among transgender and nonbinary respondents, the figures were 40% and 11%. Recruitment ran from March 4, 2025 to October 15, 2025; this voluntary sample does not establish prevalence for all LGBTQ+ young people or a population trend from the 2024 sample.
- 39.7%Students with persistent sadness or hopelessness in 2023
The overall estimate fell from approximately 42% in 2021 to 39.7% in 2023. Sadness or hopelessness was the only indicator in the report’s overall mental health and suicide summary with a significant two-year improvement; some subgroup indicators also improved. Female students reported 52.6%, compared with 27.7% for male students.
- 15.2Suicide rate per 100,000 for ages 15 to 34 in 2024
Down from 15.9 in 2023. Among 25- to 34-year-olds the rate fell 6%, from 18.4 to 17.2.
- +36.6%Increase in the suicide rate among non-Hispanic Black youth aged 10 to 24, 2018 to 2021
CDC reports a rise from 8.2 to 11.2 per 100,000, or 36.6%, the largest percentage increase among the racial and ethnic youth groups examined. The non-Hispanic AI/AN youth rate rose from 31.1 to 36.3. These historical comparisons reinforce the need for culturally responsive prevention and access to support.
What protects young people
In CDC’s 2023 analysis, school connectedness was associated with lower prevalence across the mental health and suicide indicators examined. In the Trevor Project’s 2025 voluntary survey, reported attempts were 6% among respondents in very accepting communities and 18% in very unaccepting communities. These associations cannot isolate the effect of community acceptance. In that survey, 44% of respondents who wanted mental health care reported being unable to obtain it. Suicide prevention resources can help readers find support. Sources: CDC YRBS · The Trevor Project.
Psychology.com’s suicide prevention resources describe routes to support for young people and the people around them. Survey differences reflect overlapping experiences and social conditions; they do not imply that a young person’s identity makes a suicidal outcome inevitable.
Veterans and other high-risk groups
The VA’s 2025 National Veteran Suicide Prevention Annual Report, released in March 2026, reports deaths through 2023. It shows elevated veteran rates compared with non-veteran adults after age adjustment. Separate CDC occupation data describe differences across working populations. Neither set of statistics identifies a single cause; both can inform access to care, outreach and prevention in relevant settings.
Veteran suicide deaths in 2023, an average of 17.5 a day
There were 44 fewer deaths than in the report’s revised 2022 count, while age-adjusted rates rose 3.1% for male veterans and 2.8% for female veterans. Of the average 17.5 daily deaths, 6.8 were among veterans with VHA care in 2022 or 2023 and 10.7 among those without VHA care in those two calendar years. The latter group may still have received other VA benefits or earlier care.
- +103.1%Female veterans' age-adjusted suicide rate above female non-veterans in 2023
The male gap was 49.7%. In unadjusted terms, female veterans had a rate of 13.9 per 100,000 against 7.20 for other women, and male veterans 37.8 against 28.4 for other men.
- 47.9Suicide rate per 100,000 among veterans aged 18 to 34 in 2023
The youngest veterans carry the highest rate, ahead of ages 35 to 54 (37.3), 75 and older (33.5) and 55 to 74 (31.2).
- +69.3%Rise in the age-adjusted suicide rate for male veterans from 2001 to 2023
The female veteran age-adjusted rate rose 64.1% over the same period. Increases among non-veteran adults were 11.7% for males and 41.0% for females. The larger increases among veterans underline the need for sustained prevention, while the data alone cannot explain the difference.
- -35.1%Fall in suicide rates among VHA patients with an anxiety diagnosis, 2001 to 2022
The VA’s 2024 report also found declines of 34.5% for recent VHA users with depression and 31.6% for those with PTSD, while the rate rose 16.2% for users without a documented mental health or substance use diagnosis. These are observational trends in changing patient cohorts; they do not measure the causal effect of treatment.
- -25.1%One-year fall in suicide rates among female VHA users with positive military sexual trauma screens, 2022 to 2023
Among recent VHA users with positive military sexual trauma screens, the male rate fell 26.0%. In a separate comparison, recent VHA users with documented homelessness had a rate 146.0% above those without that diagnosis in 2023. These associations support attention to trauma-informed care and housing needs without implying that one factor alone explains suicide.
- 72.0Suicide rate per 100,000 among male mining-industry workers aged 16 to 64 in 2021
In 49 states, the construction-industry rates were 56.0 for males and 10.4 for females, compared with 32.0 and 8.0 in the study’s civilian, noninstitutionalized working population. Construction and extraction occupations had rates of 65.6 for males and 25.3 for females; these were elevated, but were not the highest female occupational rate. The rates are crude and distinguish industry from occupation.
| Group | Rate | Year | Source |
|---|---|---|---|
| Male mining-industry workers, ages 16 to 64, crude | 72.0 | 2021 | CDC MMWR |
| Male construction/extraction occupations, ages 16 to 64, crude | 65.6 | 2021 | CDC MMWR |
| Veterans aged 18 to 34, crude | 47.9 | 2023 | VA |
| Male veterans, all ages, crude | 37.8 | 2023 | VA |
| AI/AN non-Hispanic males, age-adjusted | 35.3 | 2023 | NIMH |
| Male non-veteran adults, crude | 28.4 | 2023 | VA |
| Female veterans, all ages, crude | 13.9 | 2023 | VA |
| All Americans, age-adjusted | 13.7 | 2024 | NCHS |
Where the veteran numbers come from
VA surveillance links death certificates with military and VA records to identify veterans regardless of recent VHA use. Its report editions can revise earlier years: the 2024 edition counted 6,407 deaths in 2022, while the 2025 edition reports 6,398 deaths in 2023, 44 below its revised 2022 total. The two editions should not be combined to calculate a year-to-year change. The 2024 report also recorded a decline from 77.9 to 56.4 per 100,000 among recent VHA users with mental health or substance use diagnoses between 2001 and 2022, an observational cohort trend. Sources: VA 2025 report · VA 2024 report.
Trends 2019 to 2026
The U.S. age-adjusted suicide rate fell in 2020, rose in 2021 and changed little through 2023 before declining in 2024. NCHS’s longer trend analysis found no significant overall change between 2018 and 2023, although individual years did vary. The subgroup comparisons below describe specific periods and can help identify where prevention resources are needed.
Age-adjusted suicide rate per 100,000 in 2024, the lowest since 2020
The rate ran 13.9 in 2019, 13.5 in 2020, 14.1 in 2021, 14.2 in 2022 and 14.1 in 2023 before the 2.8% fall in 2024. NCHS describes 2018 to 2023 as statistically flat; the 2021 jump of 4% was the largest single-year increase between 2001 and 2021.
NCHS Data Brief 548 · NCHS Data Brief 464 · NCHS Data Brief 541
- +30%Rise in the age-adjusted rate from 2002 (10.9) to 2018 (14.2)
NCHS reports a 30% rise in the age-adjusted rate over 2002 to 2018. Separately, GAO reports an approximately 31% rise in suicide rates from 2003 through 2023. Those statements use different start and end years, and both concern rates rather than a 31% increase in the number of deaths.
- +26%Rise in the age-adjusted rate among non-Hispanic AI/AN people from 2018 to 2021
The rate rose from 22.3 to 28.1 per 100,000. Over the same years, the non-Hispanic Black rate rose 19.2% (7.3 to 8.7), the Hispanic rate rose 6.8% (7.4 to 7.9), and the non-Hispanic White rate fell 3.9% (18.1 to 17.4).
- +10.9%Rise in the rate among women aged 75 and older from 2022 to 2023
The only significant female change that year, from 4.6 to 5.1 per 100,000, while men aged 75 and older fell 7.3%. Every other age and sex group was statistically flat.
- 5 statesStates whose rates changed significantly from 2022 to 2023
Arkansas rose (18.0 to 20.2). North Dakota (22.5 to 17.8), Iowa (18.5 to 15.5), Connecticut (10.6 to 9.1) and Arizona (20.6 to 19.2) fell. The other 45 states saw no significant change.
What 2025 and 2026 look like so far
KFF reports that national Lifeline call, text and chat volume in March 2026 was 15% above a year earlier and nearly 50% above two years earlier. Contact volume reflects demand, awareness and access as well as need. It does not establish the direction of suicide mortality or demonstrate that a service caused a mortality change. The final mortality series on this page ends in 2024. Source: KFF, July 14, 2026.
Prevention and the national crisis response system
Safety planning, follow-up contact and coordinated health-system care have been studied as components of suicide prevention. The studies below use different designs and outcomes, including recorded suicidal behavior and callers’ perceptions of support. Lifeline contact volumes describe demand and service capacity; they do not count unique people or establish how many deaths were prevented.
Calls, texts and chats received by the national Lifeline from July 2022 through March 2026
KFF’s July 14, 2026 analysis reports 23.3 million contacts, including rounded components of 15.8 million calls, 4.2 million texts and 3.4 million chats; rounded components may not sum exactly. Monthly volume exceeded 600,000 over the preceding year. The figures exclude calls routed to the Veterans Crisis Line. GAO separately counted 19.1 million contacts routed through September 2025, with call, text and chat volumes up approximately 87%, 260% and 23%, respectively, from July 2022.
- 45%Fewer suicidal behaviors associated with safety planning plus follow-up in a 2018 study
The cohort comparison included 1,640 patients at nine VA emergency departments, using 2010 to 2015 data. Recorded suicidal behavior within six months was 3.03% with the intervention and 5.29% with usual care (odds ratio 0.56). The odds of attending at least one outpatient mental health visit were 2.06 times as high; an odds ratio should not be read as a doubling of probability.
- 3 of 4Implementing health systems with a significant decline in suicide attempt rates
The 2025 JAMA Network Open quality-improvement study examined patients aged 13 and older receiving outpatient specialty mental health care in six U.S. systems over 2012 to 2019. Four adopted Zero Suicide during that observation window, and three had significant declines in attempt rates after implementation. Two had estimated declines of 0.7 per 100,000 patients per month and one of 0.1. Results were site-specific associations, with an outcome that included fatal and nonfatal attempts.
- 79.6%Interviewed Lifeline follow-up clients who felt the intervention prevented them from acting on suicide
Gould and colleagues’ 2018 evaluation collected data from 550 callers, 41 crisis counselors and six centers. Among interviewed follow-up clients, 79.6% said the intervention had stopped them from taking their own life and 90.6% said it kept them safe. These participant perceptions do not measure a percentage reduction in suicide deaths.
- 26 statesStates answering at least 90% of Lifeline calls in-state in May 2026
KFF reports an increase from eight states before launch to 26 states in May 2026. In-state answer rates ranged from 62% in the District of Columbia to 99% in Mississippi and Rhode Island. Calls handled by national backup centers are outside the in-state numerator, so the local answer rate is not the overall chance of reaching a counselor.
- 38Countries reporting a national suicide prevention strategy, WHO fact sheet accessed September 13, 2026
WHO also reports that approximately 80 member states have good-quality death registration that can directly support suicide-rate estimates. Global estimates therefore require modelling in many countries. The existence of a national strategy does not establish how fully it has been implemented.
| Intervention | Result | Setting and year | Source |
|---|---|---|---|
| Safety Planning Intervention plus follow-up calls | Associated with 45% fewer suicidal behaviors; outpatient-care odds ratio 2.06 | 9 VA emergency departments, 2010 to 2015; published 2018 | JAMA Psychiatry |
| Zero Suicide model | Significant attempt-rate declines at 3 of 4 systems adopting during observation | 6 health systems, 2012 to 2019 | JAMA Network Open |
| Lifeline follow-up contact | 79.6% of interviewed follow-up clients perceived that it prevented acting on suicide | Six Lifeline centers; published 2018 | Gould et al., PubMed |
| National Lifeline capacity | Answer rate 70% (May 2022) to 89% (May 2024); wait 2:20 to 1:31 | National, 2024 | KFF |
| Observed trends in recent VHA users | Rates fell 35.1% (anxiety), 34.5% (depression), 31.6% (PTSD) among diagnosed patients, 2001 to 2022 | Observational VA surveillance; 2024 report | VA |
Means safety and service capacity
Means-safety counseling aims to reduce access to potentially lethal means during a crisis. Runyan et al., 2016. Beyond individual support, service capacity matters: KFF reported in July 2026 that 12 states had passed legislation to fund the Lifeline through telecom fees, and a 2025 survey found staffing shortages at about three in four centers. GAO describes SAMHSA’s goal of local centers answering more than 90% of texts and chats by September 2026; this is a target rather than an achieved result. Sources: KFF, July 14, 2026 · GAO, July 1, 2026.
Psychology.com’s personal safety plan worksheet and suicide risk assessment worksheet provide structured prompts about warning signs and available support. These materials do not determine immediate safety or replace a professional assessment. The directory can help readers find a licensed therapist for ongoing care. Crisis contact information appears in the FAQ below for people who need immediate support.
Common questions
How many people die by suicide in the United States each year?
Final NCHS data count 48,824 U.S. suicide deaths in 2024, with an age-adjusted rate of 13.7 per 100,000. The rate was 2.8% below 2023 (49,316 deaths; 14.1 per 100,000) and the lowest since 2020. Suicide ranked 10th overall in 2024. For 2023, NCHS ranked it second in the specific age bands 10 to 14, 15 to 24 and 25 to 44; that does not establish the ranking in every narrower age band. This page’s mortality trend uses final annual data through 2024. NCHS final mortality data.
What should I do if I am having thoughts of suicide?
In the United States, call or text 988 for the Suicide and Crisis Lifeline, available around the clock, free and confidential. Online chat is available through the Lifeline’s website. If you are in immediate danger, call 911 or go to the nearest emergency department. Outside the United States, contact your local emergency number or crisis service. Support is available even if you are unsure what to say. Suicidal thoughts can change, and timely support can help people stay safe through a crisis.
Who is most at risk of suicide?
Rates vary across populations and periods, and group statistics cannot predict an individual outcome. NCHS reports a rate of 40.7 per 100,000 among men ages 75 and older in 2023. CDC’s 2022 rural and urban age-adjusted rates were 20.0 and 13.4, respectively. Veteran surveillance and racial and ethnic comparisons identify additional differences. These patterns can inform resources and outreach while access to care, supportive environments and follow-up remain relevant across communities. NIMH suicide statistics.
Is suicide increasing or decreasing?
The answer depends on the period and population. NCHS reports that the U.S. age-adjusted rate fell from 14.1 per 100,000 in 2023 to 13.7 in 2024, following a longer increase from 2002 to 2018. National changes can differ from patterns within an age group, state or veteran population. Comparisons need consistent definitions and data status; the mortality trend displayed here uses final annual records through 2024. NCHS final mortality data.
Do crisis lines and safety plans actually work?
Research supports safety planning and follow-up as components of prevention, with results depending on the design and outcome. Stanley and colleagues’ 2018 study of 1,640 patients found 45% fewer suicidal behaviors over six months with safety planning plus follow-up in a cohort comparison without random assignment. Caller evaluations measure perceived help, while service-contact totals measure demand and can include repeated use. Neither of those measures by itself establishes a reduction in suicide deaths. Stanley et al., 2018.
Why do suicide statistics differ between sources?
Sources differ by data status, rate type, population and geography. CDC’s 2024 crude rate was 14.4 per 100,000, while the age-adjusted rate was 13.7. Age adjustment supports comparisons across populations with different age distributions. Death certificates, VA-linked records and self-reported school or household surveys also cover different people and outcomes. WHO models global estimates where death registration is incomplete. Comparable figures need matching definitions, periods and denominators. CDC FastStats.
How many veterans die by suicide each year?
The VA's 2025 National Veteran Suicide Prevention Annual Report counts 6,398 veteran suicide deaths in 2023, an average of 17.5 a day. After age adjustment, the male veteran rate was 49.7% above the male non-veteran rate and the female veteran rate 103.1% above the female non-veteran rate. Veterans aged 18 to 34 had the highest rate among veteran age groups, at 47.9 per 100,000, ahead of veterans aged 35 to 54. VA annual report.
How we compiled this
Figures were checked against the cited CDC and NCHS mortality tables, NIMH restatements of NSDUH, CDC school surveys, VA reports, WHO estimates and peer-reviewed studies. U.S. mortality comparisons use final data through 2024. Each survey and study retains its own population, period and design; observational associations are described as such. Sources sometimes differ because of age adjustment, population estimates, grouping or report revisions. This is an independent source check, and clinical review remains a separate step. Risk information is paired with prevention context and crisis support information. The September 16, 2026 pass checked NCHS final 2024 mortality, VA’s latest annual report listing, WHO’s current fact sheet and SAMHSA’s newly released 2025 survey findings. New survey rows supplement the dated 2024 displays rather than mixing years within a chart. The SAMHSA annual-report archive was unavailable; the publisher’s release analysis supplied the added figures. State mortality pages exposed definitions without their interactive values, so existing dated state rates remain unchanged. Last full review: September 16, 2026.
Journalists and researchers may reuse any statistic with attribution to the original source and a link to Psychology.com.
Cite this source
Fontane Pennock, S. (2026, September 13). Suicide Statistics 2026. Psychology.com. https://psychology.com/suicide-statistics/
References
- National Center for Health Statistics. (2026). Mortality in the United States, 2024. NCHS Data Brief No. 548. cdc.gov
- Centers for Disease Control and Prevention. (2026). Suicide data and statistics. cdc.gov
- Garnett, M. F., & Zehner, A. M. (2025). Changes in suicide rates in the United States from 2022 to 2023. NCHS Data Brief No. 541. cdc.gov
- National Center for Health Statistics. (2024). Suicide mortality in the United States, 2002 to 2022. NCHS Data Brief No. 509. cdc.gov
- National Center for Health Statistics. (2023). Suicide mortality in the United States, 2001 to 2021. NCHS Data Brief No. 464. cdc.gov
- National Center for Health Statistics. (September 24, 2025). Suicide rates largely unchanged in 2023, but still high. cdc.gov
- National Center for Health Statistics. (2026). FastStats: Suicide and self-inflicted injury. cdc.gov
- National Center for Health Statistics. (2021). Health, United States: Suicide. cdc.gov
- Stone, D. M., et al. (2024). Vital Signs: Suicide rates and selected county-level factors, United States, 2022. MMWR, 73(37). cdc.gov
- Stone, D. M., et al. (2023). Notes from the field: Recent changes in suicide rates, by race and ethnicity and age group, United States, 2021. MMWR, 72(6). cdc.gov
- National Institute of Mental Health. (2025). Suicide statistics. nimh.nih.gov
- American Foundation for Suicide Prevention. (2026). Suicide statistics. afsp.org
- World Health Organization. (2025). Suicide worldwide in 2021: Global health estimates. iris.who.int · who.int
- World Health Organization. (August 28, 2026). Suicide fact sheet. who.int
- Peterson, C., et al. (2024). Economic cost of U.S. suicide and nonfatal self-harm. American Journal of Preventive Medicine. pmc.ncbi.nlm.nih.gov
- Centers for Disease Control and Prevention. (2024). Mental health and suicide risk among high school students and protective factors: Youth Risk Behavior Survey, United States, 2023. MMWR Supplement, 73(4). cdc.gov
- Centers for Disease Control and Prevention. (2024). Youth Risk Behavior Survey Data Summary and Trends Report: 2013 to 2023. cdc.gov
- Centers for Disease Control and Prevention. (2024). Disparities among transgender and cisgender high school students: Youth Risk Behavior Survey, United States, 2023. MMWR Supplement, 73(4). cdc.gov
- Centers for Disease Control and Prevention. (2025). Suicidal thoughts and behavior: About the data. cdc.gov
- The Trevor Project. (2026). 2025 U.S. National Survey on the Mental Health of LGBTQ+ Young People. thetrevorproject.org · 2024 survey
- U.S. Department of Veterans Affairs. (March 2026). 2025 National Veteran Suicide Prevention Annual Report, Part 2: Report findings. mentalhealth.va.gov
- U.S. Department of Veterans Affairs. (2024). 2024 National Veteran Suicide Prevention Annual Report, Part 2. mentalhealth.va.gov
- Sussell, A., et al. (2023). Suicide rates by industry and occupation, National Vital Statistics System, United States, 2021. MMWR, 72(50). cdc.gov
- KFF. (July 14, 2026). Lifeline demand and capacity at its fourth anniversary as demand grows and the mental health and substance use landscape shifts. kff.org
- KFF. (2024). National crisis Lifeline: Two years after launch. kff.org
- U.S. Government Accountability Office. (July 1, 2026). Suicide prevention: Capacity and federal assessment of the national Lifeline (GAO-26-108114). gao.gov
- Stanley, B., et al. (2018). Comparison of the Safety Planning Intervention with follow-up vs usual care of suicidal patients treated in the emergency department. JAMA Psychiatry, 75(9). pmc.ncbi.nlm.nih.gov
- Zero Suicide model implementation and suicide attempt rates in outpatient mental health care. (2025). JAMA Network Open. pmc.ncbi.nlm.nih.gov
- Ahmedani, B. K., et al. (2014). Health care contacts in the year before suicide death. Journal of General Internal Medicine, 29(6). pmc.ncbi.nlm.nih.gov
- Gould, M. S., et al. (2018). Follow-up with callers to the National Suicide Prevention Lifeline: Evaluation of callers’ perceptions of care. Suicide and Life-Threatening Behavior, 48(1), 75 to 86. PubMed abstract
- Substance Abuse and Mental Health Services Administration. (2026). Release of the 2025 National Survey on Drug Use and Health: serious suicidal thoughts among adults. SAMHSA, 2025 NSDUH findings
- Substance Abuse and Mental Health Services Administration. (2026). Release of the 2025 National Survey on Drug Use and Health: adult suicide plans and attempts. SAMHSA, 2025 NSDUH findings
- Runyan, C. W., et al. (2016). Lethal means counseling for parents of youth seeking emergency care for suicidality. Western Journal of Emergency Medicine. Source
More statistics and related pages
Talk it through with a licensed therapist
Psychology.com provides a directory for finding therapists. You can use it to explore support for suicidal thoughts, depression or grief after a suicide loss, and review a provider’s listed experience and practical details.
This page is educational information, not a diagnosis or a substitute for professional care. If you are in crisis, call or text 988 (U.S. Suicide & Crisis Lifeline), any time.