
 By
By Reviewed by
In Gallup's December 2023 survey, 49% of U.S. adults said they frequently experience stress. That question differs from rating stress out of 10 or reporting stress during a lot of the previous day. The figures below retain those distinctions, so a result about employees, parents or college students is read in its own context. Each statistic links to its survey or study, with the year and population attached.
Last full review: September 16, 2026 · sourced from the American Psychological Association, Gallup, the CDC, the U.S. Surgeon General, the Federal Reserve and peer-reviewed research.
Ten numbers that define stress in 2026
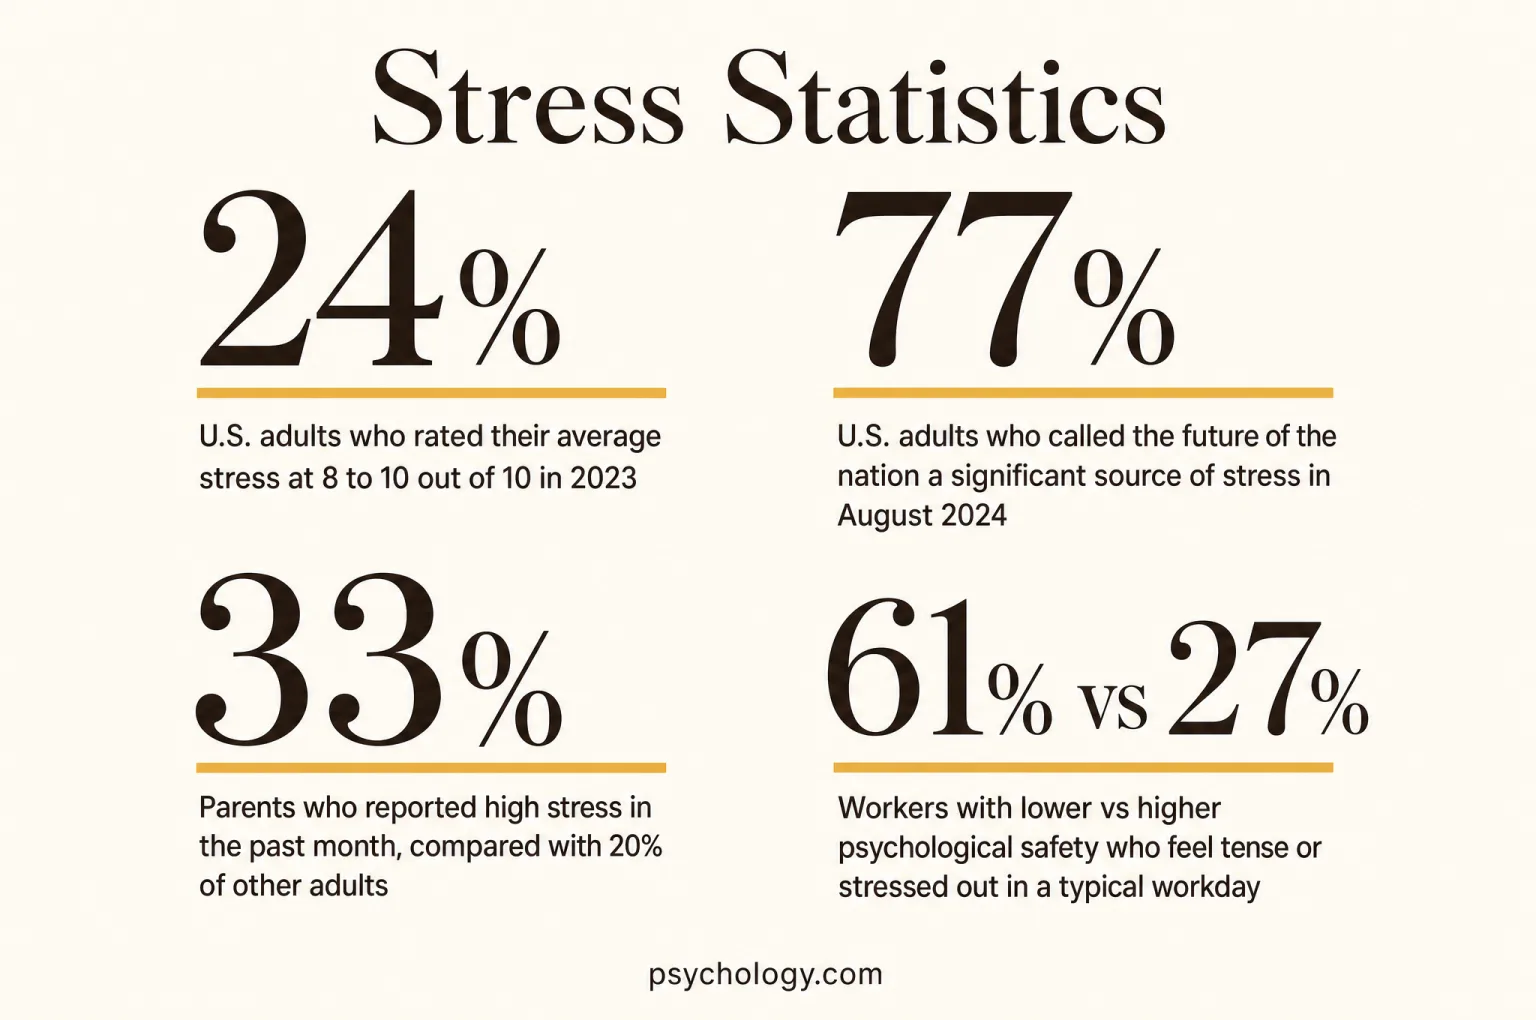
- According to APA Stress in America, 2023, 24% of U.S. adults rated their average stress at 8 to 10 on a 10-point scale in 2023, up from 19% in 2019. APA Stress in America, 2023
- According to Gallup, 2024, 49% of Americans said they frequently experience stress in December 2023, up 16 points over two decades. Gallup, 2024
- According to Gallup, 2025, 37% of adults worldwide experienced stress a lot of the previous day in 2024, across 144 countries and territories. Gallup, 2025
- According to APA Stress in America, 2024, the future of the nation (77%), the economy (73%) and the presidential election (69%) were the top significant stressors for U.S. adults in August 2024. APA Stress in America, 2024
- According to U.S. Surgeon General, 2024, 33% of parents reported high stress in the past month in 2023, compared with 20% of other adults, and 48% said their stress is completely overwhelming on most days. U.S. Surgeon General, 2024
- According to APA Stress in America, 2023, 34% of adults aged 18 to 34 rated their stress at 8 to 10 in 2023, against 9% of adults aged 65 and older. APA Stress in America, 2023
- According to Gallup, 2026, 50% of U.S. employees experienced stress a lot of the previous day on Gallup's 2023 to 2025 rolling average, compared with 40% of employees worldwide in 2025. Gallup, 2026
- According to Richardson et al., 2012, high perceived stress was associated with a 27% higher risk of incident coronary heart disease across six cohorts totaling 118,696 people (2012 meta-analysis). Richardson et al., 2012
- According to CDC NCHS, 2026, 14.0% of U.S. adults received counseling or therapy from a mental health professional in 2024; 19.3% took medication for their mental health. CDC NCHS, 2026
- According to Bankrate, 2025, 43% of U.S. adults said money hurts their mental health at least occasionally in 2025, down from 52% in 2023. Bankrate, 2025
How common stress is
There is no single stress rate, because surveys ask different questions of different people. The APA asks adults to rate an average level out of 10, Gallup asks whether stress filled a lot of yesterday, and college surveys ask about the past 30 days. Read together, they describe a country where roughly half of adults feel stressed often and about a quarter feel it intensely.
U.S. adults who rated their average stress at 8 to 10 out of 10 in 2023
The APA's Stress in America survey, conducted by The Harris Poll among 3,185 adults between August 4 and August 26, 2023, found that nearly a quarter of adults placed their average stress between 8 and 10, where 10 means a great deal of stress. That is up from 19% in 2019, before the pandemic. The rise showed up in every age group under 65. Most adults still described their own mental health as good, very good or excellent (81%), which is a reminder that high stress and a positive self-assessment can sit side by side.
APA, Stress in America 2023 press release, November 1, 2023 · APA, Stress in America 2023 report highlights
- 49%Americans who frequently experience stress, December 2023
Gallup's annual Health and Healthcare survey found nearly half of adults reporting frequent stress, a 16-point rise over the past two decades. Women (53%) were more likely than men (45%) to say so.
- 37%Adults worldwide who felt stress a lot of the previous day, 2024
Gallup's global tracking covers 144 countries and territories. Worry was slightly more common (39%), sadness stood at 26% and anger at 22%. Every negative emotion except physical pain has retreated from its pandemic high, but each remains at least four points above its 2014 level.
- 50%U.S. employees who experienced stress a lot of the previous day, 2023 to 2025 rolling average
Gallup's State of the Global Workplace country data for the United States, a rolling average of 2023 to 2025 interviews, puts daily stress at half of all employees, with no change from the prior three-year average. Only 32% are engaged at work.
- 40%Employees worldwide who experienced stress a lot of the previous day, 2025
The global figure is ten points below the U.S. figure. Worldwide, 20% of employees are engaged and 22% experienced loneliness a lot of the previous day. The report notes that global employee wellbeing improved for the first time in three years.
- 26.3%College students who rated their overall stress in the past 30 days as high, spring 2024
Among 103,639 respondents in the ACHA-NCHA reference group, a further 50.1% rated their stress as moderate. Only 1.8% reported no stress at all. Cis women (28.6%) were more likely than cis men (18.1%) to report high stress; the figure for trans and gender non-conforming students was 37.0%.
ACHA-NCHA IIIb, Spring 2024 reference group executive summary
Why the headline rates differ so much
The 24% APA figure counts only people at the top of a 10-point scale. Gallup's 49% counts anyone who says they experience stress "frequently". The global 37% asks about "a lot of the day yesterday", which captures how yesterday went rather than a general tendency. None of these is wrong; they measure different things. When you see a stress statistic quoted without its question wording, the wording is usually the missing piece.
You can rate your own recent stress with the free stress level test, which uses a validated 10-item scale rather than a single question. Screening results describe a self-reported experience and do not establish a diagnosis.
What people are stressed about: money, work and politics
When surveys ask what drives stress, three answers dominate: the state of the country, the economy and personal finances. Politics surged as a stressor in the 2024 election year, but money is the most persistent theme, showing up as the top-cited factor harming mental health for three years running in Bankrate's tracking.
U.S. adults who called the future of the nation a significant source of stress in August 2024
The APA's 2024 Stress in America survey, fielded among 3,305 adults between August 1 and August 23, 2024, found the future of the nation at the top of the list, followed by the economy (73%) and the 2024 presidential election (69%). Election stress was similar to 2020 (68%) and well above 2016 (52%). The strain showed up across party lines: 80% of Republican, 79% of Democratic and 73% of independent registered voters named the nation's future as a significant stressor. Seven in ten adults (72%) worried the results could lead to violence, and 56% believed the election could be the end of democracy.
- 43%U.S. adults who say money negatively affects their mental health at least occasionally, 2025
Bankrate's survey of 2,363 adults, fielded March 19 to 21, 2025, found money remained the top-cited factor for the third year in a row, ahead of current events (38%) and one's own health (36%). The share was 47% in 2024 and 52% in 2023.
- 69%Inflation and rising prices as a money worry among those whose mental health suffers from money, 2025
Up from 65% in 2024 and 68% in 2023. Paying for everyday expenses (61%), not having enough emergency savings (57%), lacking discretionary money (46%) and being in debt (43%) followed. Respondents could select more than one concern.
Bankrate, Money and Mental Health Survey 2025 release · Bankrate survey page
- 63%U.S. adults who would cover a $400 emergency expense with cash or its equivalent, 2025
The Federal Reserve's Economic Well-Being of U.S. Households report, released May 13, 2026, found the share unchanged from 2024. Overall, 73% of adults said they were doing okay or living comfortably financially in 2025, below the 78% high of 2021. Emergency-expense capacity provides financial context for stress surveys; it does not measure stress itself.
- 77%Adults aged 35 to 44 who named money as a significant stressor in 2023
Up from 65% in 2019. The same age group also saw the economy rise as a stressor, from 51% in 2019 to 74% in 2023, the largest shift of any group in the APA's comparison with the pre-pandemic survey.
- 73%Adults who found it stressful that false information can look so real, 2024
In the same survey, 82% worried that people base their values on false information, 32% said the political climate had strained relationships with family members, 54% had very little to no trust in the U.S. government, and 41% had considered moving to a different country because of the state of the nation.
- 17%U.S. adults who said the 2024 presidential election negatively affected their sleep
The National Sleep Foundation estimated this at about 45 million Americans. The negative effect did not differ by political party, and those affected reported shorter weekend sleep and poorer sleep quality than adults who reported no impact.
National Sleep Foundation, Sleep Health During a Presidential Election, 2024
- 75%U.S. adults who felt more stressed about the country's future than they used to, 2025
APA surveyed adults from August 4 to August 24, 2025. This retrospective comparison captures perceived change in national concerns and uses different wording from the 2024 question about significant sources of stress.
Who feels money stress most
Money stress follows income and life stage. In Bankrate's 2025 data, 48% of adults in households earning under $50,000 said money hurts their mental health, against 36% of those earning $80,000 or more. Gen X (49%), millennials (47%) and Gen Z (46%) were all far more likely to say so than baby boomers (34%), and women (45%) slightly more than men (41%). The Surgeon General's advisory adds the parent dimension: 66% of parents felt consumed by money worries in 2023, compared with 39% of other adults, and one in four parents said there had been times in the past year when they did not have enough money for basic needs.
Who is most stressed: age, sex, parents and caregivers
Stress is far from evenly distributed. Younger adults report the highest levels and older adults the lowest, women report more than men in almost every survey, and parents of children under 18 stand out on nearly every measure. Caregivers, teens and students carry their own versions of the load.
Parents who reported high stress in the past month, compared with 20% of other adults
The U.S. Surgeon General's 2024 advisory, Parents Under Pressure, draws on 2023 APA data to describe a group under unusual strain. Beyond the past-month figure, 48% of parents said their stress is completely overwhelming on most days (26% of other adults), and 41% said that on most days they are so stressed they cannot function (20% of other adults). Loneliness compounds it: in a 2021 survey cited by the advisory, about 65% of parents, and 77% of single parents, experienced loneliness, compared with 55% of non-parents. School shootings, or the possibility of one, were a significant stressor for 74% of parents.
U.S. Surgeon General, Parents Under Pressure, chapter 1 (NCBI Bookshelf), 2024
- 53% vs 45%Women vs men who frequently experience stress, December 2023
Younger women were the most likely of the four sex-by-age groups to report frequent stress, exceeding men their age by 14 points. Their level has risen 23 points since 2007, compared with an 8-point rise among older women.
- 33% vs 24%Parents of children under 18 rating their stress at 8 to 10, 2023 vs 2019
Parents were also more likely than other adults to say financial strain had increased in their household (46% vs 34%), that money causes fights in the family (58% vs 30%) and that they are so stressed they feel numb on most days (42% vs 22%).
- 29%Parents who say parenting is stressful all or most of the time (2022 survey)
Pew Research Center's survey of 3,757 U.S. parents, fielded September 20 to October 2, 2022, found mothers (33%) more likely than fathers (24%) to say so, and 41% of all parents calling parenting tiring all or most of the time.
- 56%Family caregivers who say the role makes it hard to care for their own mental health, 2023
AARP surveyed 1,001 current or recent unpaid caregivers between May 1 and May 14, 2023. Four in ten rarely or never feel relaxed and 41% report being lonely, yet 82% say caregiving gives them a sense of purpose.
AARP Research, Family Caregiving Strains Caregivers' Mental Health, 2023
- 71% vs 65%Teen girls vs boys who feel a great deal or a fair amount of pressure to get good grades, fall 2024
Pew's survey of 1,391 teens aged 13 to 17, fielded September 18 to October 10, 2024, also found girls more likely than boys to feel pressure to look good (55% vs 39%) and to fit in socially (45% vs 37%), while boys felt more pressure to be physically strong (43% vs 23%) and good at sports (36% vs 27%).
Pew Research Center, Pressures teens are facing, March 13, 2025
The 35 to 44 age group changed the most
The APA's comparison with its 2019 survey singled out adults aged 35 to 44 as the group with the largest shifts. Their reported chronic health conditions rose from 48% to 58%, and the share reporting a mental illness rose from 31% to 45%, although adults aged 18 to 34 still reported the highest rate at 50% in 2023. Across all adults, 37% said they had a diagnosed mental health condition in 2023, up five points from 32% in 2019. These are self-reports from a survey, so they describe what people say about their health rather than clinical records.
Work stress and burnout risk
Work is where much of adult stress is generated and measured. Gallup tracks daily stress among employees in more than 140 countries, the APA surveys U.S. workers every spring, and the CDC follows health workers through the General Social Survey. The common thread is that working conditions, especially psychological safety, track closely with how stressed people feel.
Workers with lower vs higher psychological safety who feel tense or stressed out in a typical workday
The APA's 2024 Work in America survey, conducted by The Harris Poll among more than 2,000 employed adults between March 25 and April 3, 2024, split workers at the median on a seven-item psychological safety scale. Those below the median were more than twice as likely to feel tense or stressed on a typical workday. Fifteen percent of workers described their workplace as somewhat or very toxic, and 89% of that group also reported lower psychological safety. Only 60% of workers described their company's culture as one that respects time off, and 45% said they work more hours per week than they want to (57% among workers living with a cognitive, emotional, learning or mental disability).
APA, 2024 Work in America Survey: Psychological Safety in the Changing Workplace (report PDF) · APA, 2024 Work in America highlights
- 19%U.S. workers who called their workplace very or somewhat toxic in 2023
Among 2,515 employed adults surveyed April 17 to 27, 2023. Workers in toxic workplaces were more than three times as likely to report harm to their mental health at work (52% vs 15%). Harassment at work in the past 12 months rose to 22%, from 14% in 2022.
- 51% vs 38%Workers who know they are monitored vs those who are not monitored or are unsure, feeling tense or stressed on a typical workday, 2024
44% of workers said their employer uses technology to monitor them while working, down from 51% in 2023 and 53% in 2022. Compared with workers who were not monitored or were unsure, those who knew they were monitored were also more likely to feel micromanaged (47% vs 23%) and to plan a job search in the next year (39% vs 21%). The report is careful to say the data cannot show that monitoring causes these feelings.
- 19.0%U.S. health workers who felt burnout very often in 2022, up from 11.6% in 2018
The CDC's Vital Signs analysis of the General Social Survey Quality of Worklife module also found health workers' poor mental health days rose from 3.3 to 4.5 per month. Harassment at work was associated with 5.83 times the odds of burnout; trusting management was associated with 0.40 times the odds.
- 44%K-12 workers who always or very often felt burned out at work, February 2022
The highest of any U.S. industry in Gallup's Panel Workforce Study of 12,319 full-time employees. Teachers specifically stood at 52% (female teachers 55%, male teachers 44%), against 30% of all other workers. In March 2020 the K-12 figure was 36%.
Gallup, K-12 Workers Have Highest Burnout Rate in U.S., 2022
- 53 hoursAverage weekly hours worked by U.S. public school teachers in 2024
RAND's 2024 State of the American Teacher survey found teachers working nine more hours a week than similar working adults (44), with about 15 of those hours outside their contracts. Only 36% of teachers said their base pay was adequate, against 51% of similar adults; 22% of teachers intended to leave their job, compared with 24% of working adults.
| Year | Daily stress | Note |
|---|---|---|
| 2019 | 38% | Pre-pandemic baseline |
| 2020 | 43% | First pandemic year |
| 2021 | 44% | Record high |
| 2022 | 44% | Record high held |
| 2023 | 41% | First decline |
| 2024 | 40% | Slight further decline |
| 2025 | 40% | Flat; U.S. employees at 50% on a 2023 to 2025 rolling average |
Source: Gallup, State of the Global Workplace global data, 2026 edition. If work stress has started to feel permanent rather than situational, the free burnout test offers structured questions about exhaustion, cynicism and reduced efficacy.
Health effects of chronic stress
The strongest evidence on stress and physical health comes from large cardiovascular studies. They consistently find that people who report high or persistent stress have a modestly higher risk of coronary heart disease and heart attack. The associations are real and repeatable, and they are also smaller than the effects of smoking or blood pressure, which matters for how the numbers get used.
Risk ratio for incident coronary heart disease among people with high perceived stress (2012 meta-analysis)
Richardson and colleagues at Columbia University Medical Center pooled six prospective cohort studies with 118,696 participants that measured self-reported perceived stress and followed people for at least six months. High perceived stress was associated with a 27% higher risk of a new CHD diagnosis, CHD hospitalization or CHD death (95% confidence interval 1.12 to 1.45). The authors describe this as a moderately increased risk. The studies date from before 2012 and used a mix of validated scales and simple single-item questions, so the estimate describes the direction and rough size of the association rather than a precise personal risk.
- 1.23Hazard ratio for coronary heart disease with job strain, 13 European cohorts (1985 to 2006)
The IPD-Work consortium's 2012 meta-analysis of 197,473 employed adults, of whom 15% reported job strain, recorded 2,358 coronary events over a mean 7.5 years of follow-up. The population attributable risk was 3.4%, which the authors contrast with the much larger effect of standard risk factors such as smoking.
- 2.14Odds ratio for heart attack with permanent work stress in the INTERHEART study (2004)
Among 11,119 people with a first heart attack and 13,648 controls in 52 countries, 10.0% of still-working cases reported permanent work stress in the previous year versus 5.0% of controls. Odds ratios were adjusted for age, sex, region and smoking. Several periods of work stress carried an odds ratio of 1.38.
- 2.12Odds ratio for heart attack with permanent stress at home (INTERHEART, 2004)
3.5% of cases reported permanent home stress versus 1.9% of controls. General stress at work, home or both carried an odds ratio of 2.17 when permanent and 1.45 for several periods. The pattern held across regions, ethnic groups and both sexes.
- 1.33Odds ratio for heart attack with severe financial stress (INTERHEART, 2004)
Severe financial stress was reported by 14.6% of cases and 12.2% of controls. Stressful life events in the past year carried an odds ratio of 1.48. Because INTERHEART is a case-control study, these are odds ratios rather than risks, and they describe associations rather than proof of cause.
- 63% vs 31%Frequent stress among adults who want more sleep vs those who get the sleep they need, December 2023
Gallup found 57% of Americans saying they would feel better with more sleep and 42% saying they get as much sleep as they need. The direction of the link runs both ways: stress disturbs sleep, and short sleep lowers the threshold for feeling stressed.
How to read these effect sizes
A hazard ratio of 1.23 means people with job strain developed coronary heart disease at about 1.23 times the rate of people without it, after adjusting for age and sex. It does not mean a 23% chance of heart disease. The INTERHEART odds ratios are larger partly because they compare people who already had a heart attack with matched controls, and recall of stress can differ after a major health event. The Kivimäki paper's own conclusion is that preventing workplace stress might lower disease incidence, with a much smaller effect than tackling smoking.
Coping and treatment
Most stressed adults handle it without professional help, and many say they downplay it. The APA's data on why people do not seek treatment sits alongside national figures on who actually receives counseling, and a growing trial literature on what stress management does to the stress hormone cortisol and to self-reported stress.
U.S. adults who said their problems are not "bad enough" to be stressed about, because others have it worse
The 2023 Stress in America survey found a majority of adults minimizing their own stress. Nearly half (47%) said they wish they had someone to help them manage it, and 62% said they do not talk about their stress because they do not want to burden others. When asked about reasons they or a family member might give for avoiding treatment, adults cited the belief that therapy does not work (40%), lack of time (39%) and lack of insurance (37%). The gap between wanting help and asking for it is one of the most consistent findings in stress research.
APA, Stress in America 2023 press release, November 1, 2023 · APA, Stress in America 2023 report highlights
- 14.0%U.S. adults who received counseling or therapy from a mental health professional in the past 12 months, 2024
From the National Health Interview Survey. A larger share, 19.3%, took medication for their mental health. The two groups overlap, so they cannot be added together.
- 16.9% vs 10.9%Women vs men who received counseling or therapy, 2024
Women were also more likely to have taken medication for their mental health (24.9% vs 13.4%). By age, adults 18 to 29 (20.2%) and 30 to 44 (18.7%) were the most likely to have received counseling or therapy, and adults 75 and older (5.0%) the least likely.
- 0.282Pooled effect size (Hedges' g) of stress management interventions on cortisol in non-patient groups
A 2024 meta-analysis of 58 randomized trials (combined N = 3,508) found interventions outperformed control conditions on cortisol measured in blood, saliva or hair. Mindfulness and meditation (g = 0.345) and relaxation (g = 0.347) were the most effective categories; talking therapies (g = 0.107) and mind-body therapies (g = 0.129) had smaller, non-significant effects.
- 0.43Cohen's d for web- and computer-based stress interventions on stress at post-test (2017 meta-analysis)
Across 26 comparisons with 4,226 participants, digital stress programs produced a small-to-moderate effect. Guided programs (d = 0.64) outperformed unguided ones (d = 0.33), and 5- to 8-week programs (d = 0.59) did better than either shorter or longer ones. Effects on depression (d = 0.34) and anxiety (d = 0.32) were small.
- 69%U.S. adults who needed more emotional support than they received in the past year, 2025
APA reported an increase from 65% in 2024. The result identifies a gap in perceived support, which can include friends and family as well as professional relationships; it is not a count of people needing clinical treatment.
| Intervention and outcome | Effect size | Source |
|---|---|---|
| Any stress management intervention, cortisol (58 trials) | g = 0.282 | Rogerson et al., 2024 |
| Cortisol awakening response measures | g = 0.644 | Rogerson et al., 2024 |
| Diurnal cortisol measures | g = 0.255 | Rogerson et al., 2024 |
| Mindfulness and meditation, cortisol | g = 0.345 | Rogerson et al., 2024 |
| Relaxation, cortisol | g = 0.347 | Rogerson et al., 2024 |
| Web or computer program, self-reported stress (26 comparisons) | d = 0.43 | Heber et al., 2017 |
| Guided digital program, self-reported stress | d = 0.64 | Heber et al., 2017 |
| Unguided digital program, self-reported stress | d = 0.33 | Heber et al., 2017 |
Effect sizes of 0.2, 0.5 and 0.8 are conventionally read as small, medium and large. Sources: Rogerson et al., 2024; Heber et al., 2017. The structured techniques with the best evidence, such as relaxation and mindfulness practice, are collected in the free stress management tools on Psychology.com.
The stress diary provides a place to record stressful situations and patterns alongside these population statistics. For readers seeking professional support, the Psychology.com directory lists a licensed therapist by location and area of practice. National treatment rates describe access across a population and cannot determine the right service for an individual.
Trends 2019 to 2026
The pandemic pushed most stress measures to record highs in 2020 to 2022. Since then, global daily stress has eased slightly, money stress has fallen from its 2023 peak, and political stress spiked with the 2024 election. The U.S. figures that rose between 2019 and 2023 have mostly stayed elevated rather than returning to their pre-pandemic levels.
U.S. adults who say money hurts their mental health at least occasionally, 2023 to 2025
Bankrate's tracking shows money stress easing from its 2023 peak of 52% to 47% in 2024 and 43% in 2025, while remaining the most-cited factor each year. The mix of worries shifted underneath: inflation and rising prices were named by 68% of affected adults in 2023, 65% in 2024 and 69% in 2025. The Federal Reserve's household survey tells a similar story of stability rather than recovery, with 73% of adults doing okay or living comfortably financially in 2024, down from the 78% high of 2021, and 63% able to cover a $400 emergency in cash, nearly unchanged from recent years.
Bankrate, Money and Mental Health Survey 2025 release · Federal Reserve, SHED 2024
- 19% to 24%U.S. adults rating their stress at 8 to 10 out of 10, 2019 to 2023
The rise was concentrated in adults under 65. Among parents of children under 18, the share went from 24% to 33%. The APA's 2024 survey focused on political stressors and did not publish a comparable top-of-scale figure in its press release.
- 38% to 40%Employees worldwide with daily stress, 2019 to 2025
The series peaked at 44% in 2021 and 2022, then fell to 41% in 2023 and 40% in 2024 and 2025. It remains two points above the pre-pandemic baseline.
- 33% to 37%Adults worldwide with daily stress, around 2013 vs 2024
Gallup's Global Emotions 2024 report, covering 2023 data from 142 countries and areas, put worldwide daily stress at 33% a decade earlier, so around 2013. Stress fell three points in 2023 to 37%, and Gallup's 2024 tracking across 144 countries and territories again found 37%. Country swings are large: Israel reached 62% in 2023 after the October attacks, and Guinea 52%.
- 52% to 69%U.S. adults naming the presidential election as a significant stressor, 2016 to 2024
The share was 52% in 2016, 68% in 2020 and 69% in 2024. Election stress affected a majority of U.S. adults in each surveyed election year since 2016, with the 2024 survey adding that 72% worried the result could lead to violence.
- 11.6% to 19.0%U.S. health workers reporting burnout very often, 2018 to 2022
The CDC's comparison of the 2018 and 2022 General Social Survey waves also recorded an extra 1.2 days of poor mental health per month. The pandemic accelerated a trend that was already described as a crisis before 2020.
- 53% to 44%U.S. workers who say their employer monitors them with technology, 2022 to 2024
One of the few workplace stress signals moving in a calmer direction: 53% in 2022, 51% in 2023 and 44% in 2024. Workers who knew they were monitored remained more likely to feel tense or stressed on a typical workday than those who were not monitored or were unsure (51% vs 38%).
| Indicator | Earlier | Later | Source |
|---|---|---|---|
| Adults rating stress 8 to 10 (U.S.) | 19% (2019) | 24% (2023) | APA |
| Parents rating stress 8 to 10 (U.S.) | 24% (2019) | 33% (2023) | APA |
| Money as a significant stressor, ages 35 to 44 (U.S.) | 65% (2019) | 77% (2023) | APA |
| The economy as a significant stressor, ages 35 to 44 (U.S.) | 51% (2019) | 74% (2023) | APA |
| Diagnosed mental health condition (U.S. adults) | 32% (2019) | 37% (2023) | APA |
| Employees with daily stress (worldwide) | 38% (2019) | 40% (2025) | Gallup |
| Health workers with burnout very often (U.S.) | 11.6% (2018) | 19.0% (2022) | CDC |
| K-12 workers burned out very often or always (U.S.) | 36% (March 2020) | 44% (February 2022) | Gallup |
What to expect from the next data releases
Publication dates vary across these sources. Gallup's State of the Global Workplace 2026 report was published in April 2026, using 2025 data. The CDC's brief on mental health treatment in 2024 was released on June 25, 2026. Check each source's publication date and data year when comparing new releases. This page is re-verified quarterly against those releases; superseded figures are replaced, and the year attached to each number is kept so trends stay comparable.
Common questions
How common is stress in 2026?
Very common, by any measure. In Gallup's December 2023 survey, 49% of U.S. adults said they frequently experience stress, up 16 points over two decades. The APA's 2023 Stress in America survey found 24% of adults rating their average stress at 8 to 10 on a 10-point scale, up from 19% in 2019. Among employees, 50% of Americans (Gallup's 2023 to 2025 rolling average) and 40% of workers worldwide (2025) experienced stress a lot of the previous day. Globally, 37% of adults in 144 countries felt that way in 2024. The exact number depends on the question asked, which is why this page keeps the wording next to every figure.
What are people most stressed about?
In the APA's August 2024 survey, the future of the nation (77%), the economy (73%) and the presidential election (69%) topped the list of significant stressors, with 72% of adults worried the result could lead to violence. Outside election years, money is the most persistent theme. Bankrate found 43% of U.S. adults saying money hurts their mental health at least occasionally in 2025, ahead of current events (38%), their own health (36%), the economy (33%) and work (25%). Among those affected, inflation and rising prices (69%) were the leading worry, followed by everyday expenses (61%) and thin emergency savings (57%).
Who is most affected by stress?
Younger adults, women and parents. In 2023, 34% of adults aged 18 to 34 rated their stress at 8 to 10, compared with 9% of adults 65 and older. Gallup found 53% of women frequently stressed versus 45% of men, with younger women's levels up 23 points since 2007. The Surgeon General's 2024 advisory reported that 33% of parents had high stress in the past month, against 20% of other adults, and that 48% find their stress completely overwhelming on most days. In separate surveys, 56% of unpaid adult caregivers said caregiving made it difficult to care for their own mental health in 2023, 26.3% of college respondents reported high stress in spring 2024, and 19.0% of U.S. health workers reported burnout very often in 2022.
Does stress cause heart disease?
The evidence shows a consistent association, and a modest one. A 2012 meta-analysis of six cohorts with 118,696 people found high perceived stress linked to a 27% higher risk of incident coronary heart disease. The IPD-Work consortium's 2012 analysis of 197,473 European workers found job strain associated with a hazard ratio of 1.23, with a population attributable risk of 3.4%, much smaller than smoking. The 2004 INTERHEART study found permanent work stress associated with about twice the odds of a first heart attack (odds ratio 2.14). These are observational findings, so they support treating chronic stress as one contributor among several rather than as a single cause.
What actually helps with stress, according to research?
Structured stress management has measurable effects. A 2024 meta-analysis of 58 randomized trials found that stress management interventions lowered cortisol relative to control conditions (g = 0.282), with mindfulness and meditation (g = 0.345) and relaxation (g = 0.347) doing best. A 2017 meta-analysis of web- and computer-based programs found a small-to-moderate effect on stress (d = 0.43), larger when guided (d = 0.64). Everyday coping matters too: in AARP's 2023 caregiver survey, 70% listened to music, 66% talked to friends or family and 52% exercised. Sleep is part of the picture; Gallup found 63% of adults who want more sleep are frequently stressed, against 31% of those who get enough.
When does stress become something to get help for?
There is no clinical cut-off, but the surveys point to warning signs: stress that feels completely overwhelming on most days (48% of parents in 2023), feeling numb from it (42%) or being unable to function (41%). Many people wait: 67% of adults said their problems were not bad enough to be stressed about, and 62% kept quiet to avoid burdening others, even though 47% wished for help. In 2024, 14.0% of U.S. adults received counseling or therapy. A licensed therapist can help sort situational stress from something that needs treatment. If stress has reached the point of thoughts of harming yourself, call or text 988, the Suicide and Crisis Lifeline, any time.
How we compiled this
This page combines national surveys from the American Psychological Association, Gallup, Bankrate, the Federal Reserve, Pew Research Center, AARP, RAND and the American College Health Association with federal data from the CDC and the U.S. Surgeon General, and with peer-reviewed cardiovascular and intervention studies. The September 13, 2026 verification fetched every source and checked all ten findings, all seven figure blocks, every data row and every chart and table against the source text, keeping survey dates, sample sizes and question wording where they affect interpretation. APA figures were read on apa.org press releases, report pages and the 2024 Work in America report PDF, using archived copies of those pages where the live site could not be reached. Odds ratios and hazard ratios are distinguished from risks, and survey associations from causal effects. Figures older than 2023 carry their data year in the text. On September 16, 2026, the annual-source update checked APA's November 6, 2025 release through an archived publisher page, Gallup's 2026 global workplace data, and the Federal Reserve's May 13, 2026 release. The new APA rows retain their distinct question wording, and the Federal Reserve row now describes 2025 observations. Historical estimates remain dated to their original surveys; this targeted update did not repeat every earlier source check. Last full review: September 16, 2026.
Journalists and researchers may reuse any statistic with attribution to the original source and a link to Psychology.com.
Cite this source
Fontane Pennock, S. (2026, September 13). Stress Statistics 2026. Psychology.com. https://psychology.com/stress-statistics/
References
- American Psychological Association. (November 1, 2023). Stress in America 2023: A nation grappling with psychological impacts of collective trauma, press release. apa.org
- American Psychological Association. (November 2023). Stress in America 2023: A nation recovering from collective trauma, report highlights. apa.org
- American Psychological Association. (October 22, 2024). APA poll: Future of nation, economy and presidential election top U.S. stressors, press release. apa.org
- American Psychological Association. (July 13, 2023). APA poll reveals toxic workplaces, other significant workplace mental health challenges, press release. apa.org
- American Psychological Association. (June 2024). 2024 Work in America Survey: Psychological safety in the changing workplace, report PDF. apa.org
- American Psychological Association. (June 2024). U.S. workers adjust to the changing nature of employment: Highlights from the 2024 Work in America survey. apa.org
- Office of the U.S. Surgeon General. (2024). Parents under pressure: The U.S. Surgeon General's advisory on the mental health and well-being of parents, chapter 1. NCBI Bookshelf. ncbi.nlm.nih.gov
- Gallup. (2024). Global Emotions 2024 report. gallup.com
- Gallup. (2025). Tracking the world's emotional health. news.gallup.com
- Gallup. (2026). State of the Global Workplace: Global data. gallup.com
- Gallup. (2026). State of the Global Workplace: United States country-level data. gallup.com
- Gallup. (April 15, 2024). Americans sleeping less, more stressed. news.gallup.com
- Gallup. (June 13, 2022). K-12 workers have highest burnout rate in U.S. news.gallup.com
- American College Health Association. (2024). ACHA-NCHA IIIb: Reference group executive summary, spring 2024. acha.org
- Bankrate. (April 30, 2025). Money and Mental Health Survey, press release. bankrate.com
- Bankrate. (2025). Money and Mental Health Survey. bankrate.com
- Board of Governors of the Federal Reserve System. (May 28, 2025). Economic Well-Being of U.S. Households in 2024, press release. federalreserve.gov
- National Sleep Foundation. (2024). Sleep health during a presidential election. thensf.org
- Richardson, S., Shaffer, J. A., Falzon, L., Krupka, D., Davidson, K. W., & Edmondson, D. (2012). Meta-analysis of perceived stress and its association with incident coronary heart disease. American Journal of Cardiology, 110(12), 1711-1716. pubmed.ncbi.nlm.nih.gov
- Kivimäki, M., Nyberg, S. T., Batty, G. D., et al., IPD-Work Consortium. (2012). Job strain as a risk factor for coronary heart disease: A collaborative meta-analysis of individual participant data. The Lancet, 380(9852), 1491-1497. pubmed.ncbi.nlm.nih.gov
- Rosengren, A., Hawken, S., Ounpuu, S., et al., INTERHEART investigators. (2004). Association of psychosocial risk factors with risk of acute myocardial infarction in 11119 cases and 13648 controls from 52 countries (the INTERHEART study). The Lancet, 364(9438), 953-962. pubmed.ncbi.nlm.nih.gov
- Nigam, J. A. S., Barker, R. M., Cunningham, T. R., Swanson, N. G., & Chosewood, L. C. (2023). Vital Signs: Health worker-perceived working conditions and symptoms of poor mental health, Quality of Worklife Survey, United States, 2018-2022. MMWR Morbidity and Mortality Weekly Report, 72(44), 1197-1205. pubmed.ncbi.nlm.nih.gov
- Rogerson, O., Wilding, S., Prudenzi, A., & O'Connor, D. B. (2024). Effectiveness of stress management interventions to change cortisol levels: A systematic review and meta-analysis. Psychoneuroendocrinology, 159, 106415. pubmed.ncbi.nlm.nih.gov
- Heber, E., Ebert, D. D., Lehr, D., Cuijpers, P., Berking, M., Nobis, S., & Riper, H. (2017). The benefit of web- and computer-based interventions for stress: A systematic review and meta-analysis. Journal of Medical Internet Research, 19(2), e32. pubmed.ncbi.nlm.nih.gov
- National Center for Health Statistics. (June 25, 2026). Mental health treatment among adults: United States, 2024. NCHS Data Brief No. 564. cdc.gov
- Pew Research Center. (January 24, 2023). Parenting in America today. pewresearch.org
- Pew Research Center. (March 13, 2025). Pressures teens are facing, in The gender gap in teen experiences. pewresearch.org
- AARP Research. (2023). Family caregiving strains caregivers' mental health. aarp.org
- RAND Corporation. (June 18, 2024). Teachers report working more hours, greater stress than similar working adults, press release. rand.org
- American Psychological Association. (November 6, 2025). APA poll reveals a nation suffering from stress of societal division, loneliness. apa.org
- Board of Governors of the Federal Reserve System. (May 13, 2026). Economic Well-Being of U.S. Households in 2025, press release. federalreserve.gov
More statistics and related pages
Talk it through with a licensed therapist
If the stress in your life has stopped feeling temporary, a licensed therapist can help you work out what is driving it and what would actually change it. Browse license-verified therapists on the internet's original directory.
This page is educational information, not a diagnosis or a substitute for professional care. If you are in crisis, call or text 988 (U.S. Suicide & Crisis Lifeline), any time.