
 By
By Reviewed by
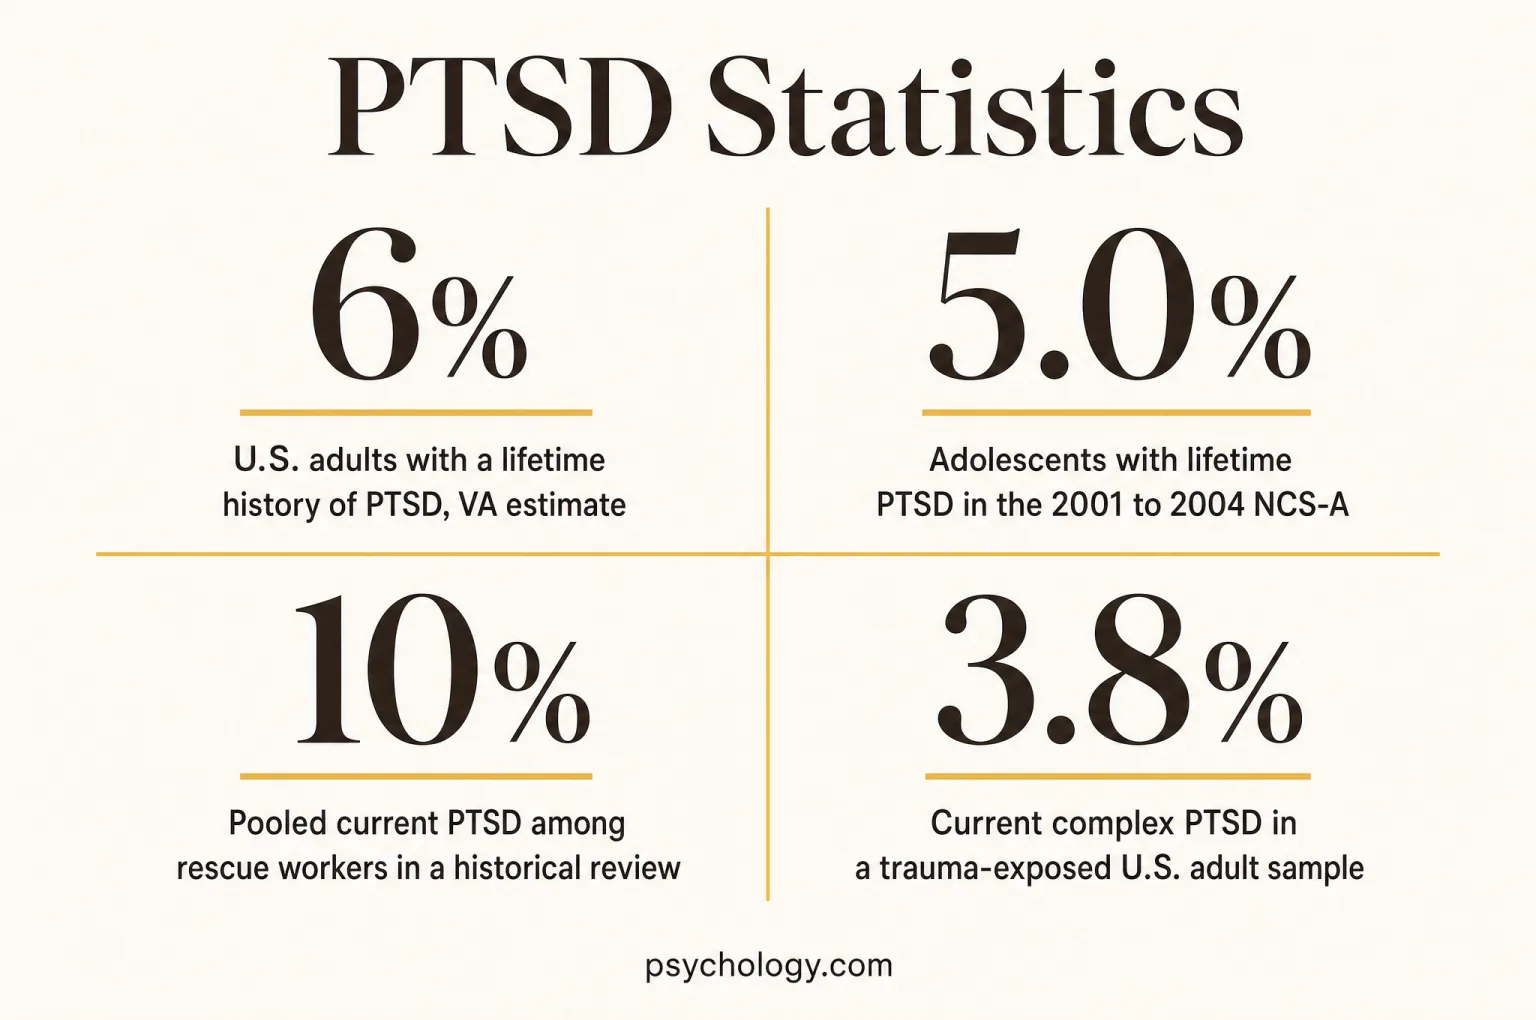
About 6% of U.S. adults experience PTSD during their lives, according to the VA’s rounded estimate from the 2012 to 2013 NESARC-III survey. Lifetime prevalence includes people whose symptoms have since improved. In the 2025 to 2026 National Health and Resilience in Veterans Study, 7.3% of veterans screened positive for past-month PTSD. That different population and shorter reference period prevent a direct comparison with the adult lifetime estimate. Sources were checked again on September 16, 2026, with original observation years retained.
Last full review: September 16, 2026 · sourced from the VA National Center for PTSD, NIMH, CDC research, World Mental Health Surveys and peer-reviewed studies.
Ten numbers that define PTSD in 2026
- About 6% of U.S. adults experience PTSD during their lives, according to VA’s rounded estimate from the 2012 to 2013 NESARC-III survey. VA National Center for PTSD, 2026
- NIMH reports that 3.6% of U.S. adults had past-year PTSD in the 2001 to 2003 NCS-R; its lifetime estimate was 6.8%. NIMH, NCS-R 2001 to 2003
- NIMH reports that 5.0% of adolescents aged 13 to 18 had lifetime PTSD in the 2001 to 2004 NCS-A, including 8.0% of girls and 2.3% of boys. NIMH, NCS-A 2001 to 2004
- Koenen and colleagues’ 2017 analysis found that across World Mental Health Surveys conducted in 2001 to 2012, lifetime PTSD affected 3.9% of respondents and 5.6% of those exposed to trauma. Koenen et al., 2017
- Pietrzak and colleagues’ 2026 study found that 7.3% of U.S. veterans screened positive for past-month PTSD in the 2025 to 2026 NHRVS, compared with 5.0% in its 2019 to 2020 wave. Pietrzak et al., 2026; Wisco et al., 2022
- Cloitre and colleagues’ 2019 report found that 3.8% of trauma-exposed U.S. adults in a March 2017 survey met the study’s criteria for ICD-11 complex PTSD. Cloitre et al., 2019
- 63.9% of adults reported at least one adverse childhood experience in CDC’s 2023 analysis of combined 2011 to 2020 data; that measures exposure rather than PTSD. CDC, 2023
- Davis and colleagues’ 2022 model estimated that PTSD’s excess economic burden in the United States was $232.2 billion in 2018, including costs outside medical care. Davis et al., 2022
- Lewis and colleagues’ 2020 review found 16% pooled dropout from adult PTSD psychotherapy trials, with considerable variation between studies. Lewis et al., 2020
- Koenen and colleagues’ 2017 analysis found that among people with past-year PTSD in the 2001 to 2012 World Mental Health Surveys, 22.8% sought treatment in low- and lower-middle-income countries. Koenen et al., 2017
How common PTSD is
U.S. estimates depend on when researchers asked, whom they included and which diagnostic definition they used. The VA’s rounded figures come from a different survey than NIMH’s widely cited numbers. Both are useful historical benchmarks, but neither is a new national count taken in 2026.
U.S. adults with a lifetime history of PTSD, VA estimate
The VA’s current summary reports that about six in every hundred U.S. adults experience PTSD at some point. Its professional epidemiology page traces that estimate to NESARC-III, conducted in 2012 to 2013 using DSM-5 criteria. Lifetime prevalence includes earlier episodes that have resolved. It therefore describes the reach of PTSD across people’s lives, while leaving open how many are experiencing symptoms today. VA’s survey background explains the source population and diagnostic framework.
- 5%VA’s rounded annual U.S. adult estimate
VA’s summary of the 2012 to 2013 NESARC-III data places past-year PTSD at about five in every hundred adults; an annual estimate includes anyone meeting criteria during that year, even if their symptoms were absent on the day they answered the survey.
- 13 millionEstimated Americans with PTSD in 2020
VA gives this approximate count for 2020, illustrating the number of people behind a relatively small percentage; it should remain attached to that year because population size and the assumptions used to estimate a total can change over time.
- 6.8%NIMH’s historical lifetime adult estimate
The NCS-R interviewed U.S. adults in 2001 to 2003 using DSM-IV criteria; its lifetime figure is still widely quoted, but comparison with a later DSM-5 survey combines changes in measurement with possible changes in the population being studied.
- 3.6%Past-year adult PTSD in the NCS-R
This estimate comes from the same 2001 to 2003 survey as the lifetime figure above; the smaller percentage reflects its shorter observation window, so the gap between them cannot be read as a recovery rate among individual respondents.
- 3.9%Cross-national lifetime PTSD in the WMH surveys
Koenen and colleagues’ 2017 analysis combined surveys fielded in 2001 to 2012 across different countries; this is an estimate for the surveyed populations, with differences in coverage and reporting, rather than a census of every country or a 2026 worldwide rate.
- 5.6%Lifetime PTSD among trauma-exposed WMH respondents
Restricting the 2001 to 2012 survey denominator to people who had experienced trauma raises the percentage; most trauma-exposed respondents still did not meet lifetime PTSD criteria, showing why trauma exposure and PTSD prevalence need separate labels.
Trauma exposure is more common than PTSD
The 2017 WMH trauma analysis found lifetime trauma exposure in 70.4% of respondents across surveys conducted in 2001 to 2012 (Kessler et al., 2017). Exposure prevalence uses everyone surveyed as its denominator, while conditional PTSD estimates concern particular traumatic experiences. Combining these measures without checking their denominators can exaggerate the burden. Household surveys may also miss people whose circumstances make participation difficult.
PTSD among refugees and asylum seekers
Blackmore and colleagues’ 2020 review estimated PTSD prevalence at 31.46% among adult refugees and asylum seekers assessed through clinical interviews (Blackmore et al., 2020). Its search ended on February 4, 2020, with substantial differences between studies. The estimate describes displaced populations and cannot be applied to all migrants, a particular individual or people displaced by later conflicts.
Psychology.com’s PTSD screening questionnaire provides a structured way to reflect on symptoms; a questionnaire score and a clinician’s diagnosis are different kinds of information.
Who is most affected: sex, age and trauma type
Women and girls had higher PTSD prevalence than men and boys in the historical U.S. surveys below. Risk also varies with the experience itself. Trauma-specific estimates help explain differences between groups, although a survey cannot reduce a person’s history, support network or circumstances to one demographic category.
Adolescents with lifetime PTSD in the 2001 to 2004 NCS-A
NIMH reports this estimate for U.S. adolescents aged 13 to 18. The same survey found that 1.5% of all adolescents had PTSD with severe impairment. The impairment figure uses the full adolescent sample, so it is not the percentage of adolescents with PTSD whose illness was severe. These diagnostic interviews remain an important national benchmark, but they were completed well before the pandemic and cannot establish today’s prevalence among teenagers.
- 5.2%Past-year PTSD among adult women
Women had higher past-year prevalence in the 2001 to 2003 NCS-R; trauma exposure patterns may contribute, although this descriptive comparison cannot identify how much of the difference comes from any particular cause.
- 1.8%Past-year PTSD among adult men
The male estimate in the 2001 to 2003 NCS-R represents a meaningful burden; lower group prevalence cannot establish whether a particular man has symptoms or how those symptoms affect daily life.
- 8.0%Lifetime PTSD among adolescent girls
Girls had higher lifetime prevalence than boys in the 2001 to 2004 adolescent survey; this comparison describes separate groups at one historical period, rather than tracking changes as individual girls grew older.
- 2.3%Lifetime PTSD among adolescent boys
The 2001 to 2004 estimate documents PTSD among boys; differences in experiences, disclosure and symptoms matter when interpreting survey results and making sense of the needs of young people who have experienced trauma.
- 8%VA’s rounded lifetime estimate for adult women
The 2012 to 2013 NESARC-III survey underlies VA’s estimate; its lifetime reference period and DSM-5 criteria differ from NIMH’s older past-year figures, limiting direct comparison.
- 4%VA’s rounded lifetime estimate for adult men
VA’s male lifetime estimate comes from the 2012 to 2013 survey framework; it counts current and previous PTSD, including people whose symptoms have improved since an earlier episode.
| Trauma type | Conditional risk | Source |
|---|---|---|
| Rape | 19.0% | Kessler et al., 2017 |
| Physical abuse by a romantic partner | 11.7% | Kessler et al., 2017 |
| Kidnapping | 11.0% | Kessler et al., 2017 |
| Sexual assault other than rape | 10.5% | Kessler et al., 2017 |
What the trauma comparisons measure
The WMH analysis weighted assessments of people’s worst and randomly selected traumatic experiences. Its estimates concern PTSD associated with those exposures. Retrospective interviews can be affected by recall and disclosure. Studies recruited immediately after an assault may report much higher symptom levels than household surveys years later, but early distress and a diagnosis meeting a required duration threshold are distinct outcomes.
Veterans and first responders
Military and emergency-service work can involve repeated exposure to life-threatening events. The available estimates describe different groups: veterans in household surveys, combat veterans from particular eras, VA patients and active first responders. Each group has a different selection process, so the percentages need to stay attached to their original populations.
Pooled current PTSD among rescue workers in a historical review
Berger and colleagues’ 2012 review combined studies published through 2008 and found a pooled current prevalence of 10%. The included occupations and settings differed substantially, and police samples were restricted to officers exposed to major disasters. This historical result established a substantial occupational burden, but its sampling rules do not support a precise current estimate for every emergency-service occupation.
- 14.7%Past-month probable PTSD among Iraq/Afghanistan combat veterans
The 2019 to 2020 NHRVS combat-veteran analysis used a symptom checklist; this exact percentage differs from the rounded public VA summary and describes a positive screen among surviving survey participants, rather than a clinician-confirmed diagnosis in everyone who served.
- 14.4%Past-month probable PTSD among Gulf War combat veterans
The same 2019 to 2020 survey found this percentage among Gulf War participants; comparing service eras also compares people with different ages, trauma histories and lengths of time since service, which limits explanations based solely on the war itself.
- 5.0%Past-month probable PTSD among Vietnam combat veterans
This estimate concerns veterans alive and participating in the 2019 to 2020 survey; it does not include people who had died, and it should not replace earlier Vietnam-era studies that measured different cohorts closer to their military service.
- 1.6%Past-month probable PTSD among WWII/Korean War combat veterans
The oldest service-era group in the 2019 to 2020 survey was small and strongly affected by survival into old age; a low current percentage in this selected group cannot establish that wartime exposure originally carried little psychological risk.
- 14%Male VA patients diagnosed with PTSD in fiscal year 2024
VA’s administrative summary applies to men who used its health-care system; patient selection and routine screening help explain why a clinical-service percentage can exceed a national survey estimate, without implying that receiving VA care causes PTSD.
- 24%Female VA patients diagnosed with PTSD in fiscal year 2024
The corresponding percentage among female VA patients was higher; the agency identifies military sexual trauma as relevant context, while these service records alone cannot quantify how much of the difference between women and men is attributable to that experience.
- 12.5% versus 6.7%Past-month probable PTSD among female and male veterans, respectively, in 2025 to 2026
The NHRVS publisher summary reports these weighted percentages from a national veteran survey; lifetime estimates were 28.5% and 12.6%, respectively. Checklist-based probable PTSD differs from a recorded diagnosis among VA patients, so the sex comparison should remain attached to the survey population.
Journal of Clinical Psychiatry, publisher summary of Pietrzak et al., 2026
- 16.1% versus 2.8%Past-month probable PTSD among veterans aged 18 to 44 versus 60 and older, 2025 to 2026
The publisher reports lifetime prevalence of 35.3% and 5.7% in those age groups, respectively. These cross-sectional differences can reflect exposure histories, reporting and survival into older age; they do not track the same people aging or establish an individual recovery rate.
Journal of Clinical Psychiatry, publisher summary of Pietrzak et al., 2026
| Service era | Lifetime prevalence | Source |
|---|---|---|
| Iraq/Afghanistan | 29.3% | Na et al., 2023 |
| Gulf War | 20.9% | Na et al., 2023 |
| Vietnam | 9.7% | Na et al., 2023 |
| WWII/Korean War | 3.2% | Na et al., 2023 |
Firefighter suicide research has a different denominator
In Stanley and colleagues’ 2015 web survey, 46.8% of participating current or retired firefighters reported suicidal thoughts during their careers, and 15.5% reported an attempt (Stanley et al., 2015). Recruitment used a convenience sample, making these unsuitable as national prevalence estimates. The figures concern suicidal experiences across careers, rather than PTSD diagnoses, annual risk or deaths attributable to PTSD.
Survey estimates and VA service records can both inform planning, but they answer different questions. A national survey includes veterans who obtain care outside the VA as well as people who have not sought care. Administrative figures instead describe those using the service and receiving a recorded diagnosis. The age and sex comparisons here therefore complement the service-era table without replacing its historical results.
Complex PTSD, childhood trauma and ACEs
Complex PTSD and adverse childhood experiences describe different things. CPTSD is a diagnostic category in ICD-11, while ACEs measure potentially traumatic experiences before adulthood. An ACE count can help researchers study patterns of exposure and later health, but it does not establish PTSD, CPTSD or any other diagnosis.
Current complex PTSD in a trauma-exposed U.S. adult sample
Cloitre and colleagues surveyed adults in March 2017 and reported the results in 2019. Participants were aged 18 to 70 and had experienced at least one traumatic event. Using the International Trauma Questionnaire, 3.8% met the study’s ICD-11 CPTSD criteria. The trauma-exposure requirement matters: this percentage describes eligible respondents, rather than an unrestricted sample of every U.S. adult. It is also a current symptom-based estimate, rather than a lifetime probability.
- 3.4%Current ICD-11 PTSD in the same survey
The March 2017 study classified PTSD separately from CPTSD; keeping the diagnostic framework visible prevents this narrower ICD-11 category from being mistaken for an equivalent estimate of DSM-5 PTSD in a different national survey.
- 7.2%Either PTSD or CPTSD among eligible respondents
The combined March 2017 estimate reflects the study’s mutually exclusive diagnostic classifications; respondents meeting CPTSD criteria were not counted a second time in the PTSD-only category, so the combined figure has a clear denominator and avoids double counting.
- 63.9%Adults reporting at least one ACE
CDC’s 2023 analysis pooled BRFSS data collected in 2011 to 2020 across U.S. jurisdictions; the result describes recalled childhood exposures, which may include abuse and household challenges, without measuring whether respondents subsequently developed a trauma-related disorder.
- 17.3%Adults reporting four or more ACEs
In the same 2011 to 2020 CDC dataset, multiple childhood adversities were common; counting exposure categories helps identify population patterns but does not capture every experience’s severity, duration, context or meaning for the person who experienced it.
- 25.2%Adults aged 25 to 34 reporting four or more ACEs
This age-group estimate comes from CDC’s pooled 2011 to 2020 data; age differences may involve recall, generational exposure patterns and survival, so the result should not be interpreted as tracking one group from childhood into its thirties.
- 19.2%Women reporting four or more ACEs
CDC’s 2011 to 2020 analysis found this percentage among female adults; it measures multiple forms of reported childhood adversity and cannot be used as a female PTSD prevalence rate or an individual probability of developing CPTSD.
Why the diagnostic framework changes the count
The VA explains that ICD-11 CPTSD includes PTSD symptoms alongside difficulties in emotion regulation, self-concept and relationships (VA, complex PTSD definitions). DSM-5 expanded its PTSD criteria to capture some of those symptoms rather than adding a separate diagnosis. Older CPTSD proposals also used different symptom rules. A study’s diagnostic system affects who qualifies, so differences between estimates can reflect measurement decisions even when the underlying experiences are similar.
Psychology.com’s complex PTSD questionnaire and childhood trauma questionnaire address different questions, just as the research distinguishes current symptoms from earlier experiences.
The five senses grounding exercise and window of tolerance worksheet offer educational ways to describe experiences and questions for a professional conversation. They do not measure ACE exposure, establish a PTSD diagnosis or reproduce the therapies evaluated in the research below. A study’s population-level findings have a different purpose from understanding an individual’s circumstances.
Impact: health, suicide risk and cost
PTSD can affect daily functioning and occur alongside depression, substance use disorders and physical illness. Economic studies place a value on health care, disability and lost work, while mortality studies measure associations with different outcomes. These approaches describe complementary parts of the burden, with different limits on what they can explain.
Estimated excess U.S. economic burden of PTSD in 2018
Davis and colleagues’ 2022 model compared costs associated with PTSD against costs among people without PTSD or the general population. Its societal total included health care and wider effects such as unemployment, disability and caregiving. The result is an annual estimate expressed for 2018, rather than a 2026 spending figure or a forecast. Many of the costs fall outside a person’s medical bills.
- $19,630Annual excess cost per modeled person with PTSD
The 2018 economic model divided its estimated burden across the population with PTSD; this average combines different types of costs and circumstances and should not be interpreted as an individual’s treatment bill or insurance coverage requirement.
- 52%Current major depression among people with current PTSD
Rytwinski and colleagues’ 2013 meta-analysis found frequent co-occurring depression; overlapping symptoms and impairment make the distinction between a second diagnosis and the effects of PTSD particularly relevant when researchers estimate disability or the need for services.
- 44.6%Lifetime PTSD cases with alcohol or other substance use disorder
VA cites an analysis of the 2012 to 2013 NESARC-III survey for this lifetime overlap; it describes co-occurrence and does not establish that PTSD caused substance use, or that both conditions were active at the same time.
- 1.27Coronary heart disease hazard ratio after depression adjustment
Edmondson and colleagues’ 2013 review pooled prospective observational estimates; the elevated hazard persisted after adjustment for depression, but remaining differences between groups mean the result cannot establish how much cardiovascular risk would change if PTSD symptoms improved.
- 2.09Pooled relative risk of suicide death associated with PTSD
Akbar and colleagues’ review, published online in 2022, found an elevated relative risk across studies; it is a comparison between groups, rather than a percentage of people who die by suicide or a prediction about an individual’s future.
- 36.6%Serious impairment among adults with past-year PTSD
NIMH’s 2001 to 2003 NCS-R figures assessed disruption across work, home and relationships; serious impairment describes functional effects among PTSD cases, which differs from both the prevalence of PTSD in all adults and a measure of suicide risk.
| Population | Excess burden | Annual excess cost per person | Source |
|---|---|---|---|
| Civilian | $189.5 billion | $18,640 | Davis et al., 2022 |
| Military | $42.7 billion | $25,684 | Davis et al., 2022 |
| Combined | $232.2 billion | $19,630 | Davis et al., 2022 |
Treatment, recovery and the care gap
Research distinguishes symptom improvement, remission, treatment completion and whether people find care helpful. Those outcomes answer different questions. Trials show benefits from psychological therapies, while community surveys describe uneven access and substantial delays. Historical recovery estimates also vary with the time since trauma and the definition used to identify a case.
Average remission in a review of long-term outcomes without specific treatment
Morina and colleagues’ 2014 review found that this share of baseline PTSD cases no longer met case criteria at follow-up, across studies with a mean observation period of forty months. Individual study results varied widely. This observational estimate is useful context for the course of PTSD, but it cannot determine whether a particular person will recover, how long recovery will take or which services they will need.
- -1.62Standardized symptom difference for trauma-focused CBT
The 2013 Cochrane review found lower clinician-rated PTSD severity than with waitlist or usual care; this standardized mean difference uses a symptom scale’s variability and therefore is not a percentage improvement, remission rate or number of people recovered.
- -1.17Standardized symptom difference for EMDR
The same 2013 Cochrane review found a benefit over waitlist or usual care; evidence quality was rated very low, and comparing this effect size with CBT’s result does not establish which treatment would work better for a particular person.
- 16%Pooled dropout from PTSD psychotherapy trials
Lewis and colleagues’ 2020 review found considerable variation across adult randomized trials; dropout measures study or treatment retention under the included definitions, so it should not be treated as the percentage of people for whom therapy cannot help.
- 22%Pooled prolonged exposure dropout
The prolonged exposure estimate in the 2020 review came from a different set of trials than the other therapy estimates; variation in recruitment, treatment settings and definitions limits direct comparisons of acceptability between named approaches.
- 18%Pooled EMDR dropout
Lewis and colleagues’ 2020 review reported this estimate for EMDR and 30% for cognitive processing therapy; the percentages describe the trials included at that time and cannot be assumed to represent today’s routine-care outcomes in every service.
- 57.0%Treatment seekers who eventually reported helpful care
Stein and colleagues’ 2020 analysis of earlier World Mental Health Surveys asked whether respondents had ever received PTSD treatment they considered helpful; this patient-reported outcome captures perceived benefit, while leaving clinical remission and treatment adequacy as separate questions.
| Group | Estimated median | Source |
|---|---|---|
| Post-9/11 veterans | 2.5 years | Goldberg et al., 2019 |
| Pre-9/11 veterans | 16.0 years | Goldberg et al., 2019 |
| Civilians | 15.0 years | Goldberg et al., 2019 |
What treatment delay and recovery estimates mean
The delay figures use Kaplan-Meier estimates of the time at which half the group had received treatment, accounting for respondents who had not yet done so. They are not simple averages among treatment users. Trauma context also matters: Morina’s 2014 review reported mean remission of 60.0% in natural-disaster-related PTSD publications and 31.4% in physical-disease-related PTSD publications (Morina et al., 2014). Different study populations and follow-up schedules limit interpretation of that contrast.
| Country income group | Treatment seeking | Source |
|---|---|---|
| High income | 53.5% | Koenen et al., 2017 |
| Upper-middle income | 28.7% | Koenen et al., 2017 |
| Low/lower-middle income | 22.8% | Koenen et al., 2017 |
Any treatment includes a broad range of services
Only 3.2% of respondents with past-year PTSD in low- and lower-middle-income WMH countries received specialty mental health treatment in the 2001 to 2012 surveys (Koenen et al., 2017). The broader treatment-seeking measure includes other sources of help. Contact with a service does not establish that someone received a complete course of a therapy tested in clinical trials.
For a conversation about support and assessment, Psychology.com’s directory can help people find a licensed therapist. The treatment-access figures above distinguish seeking any help from receiving specialty mental health care. Neither measure establishes that a person completed a specific therapy, which is why access, treatment completion and symptom improvement need separate interpretation.
Trends 2019 to 2026
Recent veteran surveys support an increase in measured PTSD prevalence, while college and first-responder studies document changes in other populations. These findings do not amount to a single annual U.S. trend. The date a paper appears, the period participants recall and the years when data were collected each affect interpretation.
Past-month probable PTSD among veterans surveyed in 2025 to 2026
Pietrzak and colleagues’ 2026 paper analyzed a nationally representative web survey and reported a higher weighted past-month prevalence than earlier NHRVS waves. The estimate’s confidence interval ran from 6.0% to 8.9%, reflecting sampling uncertainty. Repeated survey waves strengthen the evidence of a population change, while shifts in trauma exposure, demographics and reporting still matter when considering why prevalence increased.
- 14.4%Lifetime probable PTSD in the 2025 to 2026 veteran survey
The latest NHRVS lifetime estimate includes earlier episodes as well as current PTSD; because it accumulates experience over people’s lives, it should not be described as the share currently needing the same level or type of care.
- 5.0%Past-month probable PTSD in the 2019 to 2020 veteran survey
Wisco and colleagues assessed veterans from November 2019 to March 2020; much of this baseline was collected before widespread pandemic disruption, making it a useful historical comparison while limiting claims about a single cause for the later change.
- 9.4%Lifetime probable PTSD in the 2019 to 2020 veteran survey
This earlier NHRVS estimate provides context for the higher lifetime percentage reported in 2025 to 2026; comparisons concern weighted survey populations and do not mean that the same percentage of previously unaffected individuals developed PTSD between the waves.
- 14.3%PTSD prevalence in routine-exposure first-responder samples
Arena and colleagues’ 2025 review analyzed research published after 2008 and found some evidence of increasing prevalence over time in routine-exposure samples; the authors linked much of the observed rise to studies since the pandemic, without isolating a causal effect.
- 8.3%PTSD prevalence in disaster-exposed first-responder samples
The same 2025 review found a lower pooled estimate in samples defined by large-scale disasters; differences in measurement, recruitment and assessment timing mean this contrast does not show that disaster response protects workers compared with routine emergency duties.
- 7.5%Reported PTSD diagnosis among college students in 2022
The UAB researchers’ 2024 report describes an increase from 3.4% in 2017 to 7.5% in 2022; a rise in reported diagnosis may involve changes in symptoms, recognition and access to assessment, and cannot be generalized to all young adults.
Veteran suicide totals measure a separate outcome
VA’s report released on February 5, 2026 counted 6,398 veteran suicide deaths in 2023, down from 6,442 in 2022 (VA annual report announcement). These totals cover veterans regardless of PTSD status and cannot establish PTSD-attributable deaths. Population size and composition also matter: the same release reports that the suicide rate per 100,000 veterans rose slightly for both men and women in 2023, so a lower death count can coexist with a higher rate.
Common questions
How common is PTSD in the United States?
VA’s rounded estimate is about 6% over a lifetime and 5% in a given year, based on the 2012 to 2013 NESARC-III survey. NIMH’s older 2001 to 2003 survey gives 6.8% lifetime and 3.6% past-year prevalence. The surveys used different diagnostic criteria. These estimates describe populations at historical survey periods, rather than a fresh national count for 2026. VA epidemiology explains the later survey basis.
Is PTSD more common in women?
Yes, in the U.S. surveys summarized here. The 2001 to 2003 NCS-R found past-year PTSD in 5.2% of women and 1.8% of men. VA’s later rounded lifetime estimates are 8% and 4%, based on 2012 to 2013 data. Trauma exposure patterns contribute to these differences, but demographic averages cannot determine whether an individual has PTSD. NIMH provides the historical sex-specific tables.
How common is complex PTSD?
Cloitre and colleagues’ March 2017 U.S. survey found current ICD-11 complex PTSD in 3.8% of trauma-exposed adults aged 18 to 70. Another 3.4% met PTSD-only criteria, giving 7.2% for either classification. The exposure requirement and diagnostic system matter, so this is not an unrestricted lifetime estimate for all adults. The original study describes the eligible sample and the questionnaire used.
Do people recover from PTSD?
Many people improve, and some no longer meet diagnostic criteria. A 2014 review found average remission of 44.0% without specific treatment across long-term observational studies, with wide variation between studies. That estimate differs from symptom improvement during a clinical trial and does not predict an individual’s course. The timing of assessment, trauma context and definition of remission all affect the result. Morina et al., 2014 provides the historical estimate.
Has PTSD become more common among veterans?
The NHRVS provides evidence of an increase: past-month probable PTSD was 5.0% in 2019 to 2020 and 7.3% in 2025 to 2026. Lifetime estimates were 9.4% and 14.4%, respectively. These repeated survey results concern veterans and cannot establish a trend for every U.S. adult. Changes in exposure, population composition and reporting are relevant to interpreting the increase. Pietrzak et al., 2026 compares the survey waves.
Does PTSD increase suicide risk?
Studies associate PTSD with elevated suicide risk, but group statistics cannot predict a particular person’s future. A review published online in 2022 estimated a suicide mortality relative risk of 2.09; that is not a percentage of people who die by suicide. Akbar et al. describe the pooled evidence. If you or someone you know is thinking about suicide, call or text 988 in the United States for the Suicide and Crisis Lifeline.
How we compiled this
Psychology.com checked source text on September 13, 2026, using original studies, federal survey summaries and accessible NCBI records. The source bank preserves the figure, population, data period and a brief verbatim excerpt for each candidate. Publication years are distinguished from collection years, and historical estimates retain their dates. Screen-positive PTSD, diagnosed PTSD, lifetime prevalence and current prevalence remain separate measures. Relative risks and standardized symptom differences are labeled by their original units. Cross-sectional comparisons do not establish causes, and pooled estimates retain important population limits. Blocked pages were replaced with accessible versions where available; unverified figures were omitted. Cost estimates retain their original model year. On September 16, 2026, VA adult, veteran and professional epidemiology summaries and NIMH were fetched again, together with the annual VA suicide-report announcement. CDC’s original ACE report was retrieved through archive transport and is cited at its publisher URL. The new veteran subgroup figures were read in the journal’s public summary of its 2026 paper; the journal abstract independently confirmed the overall prevalence figures. Every existing citation was requested again. Access challenges prevented full re-verification of some unchanged historical research. A newer therapy-dropout press release was inaccessible, so no numerical replacement was made from its search snippet. Last full review: September 16, 2026.
Journalists and researchers may reuse any statistic with attribution to the original source and a link to Psychology.com.
Cite this source
Fontane Pennock, S. (2026, September 13). PTSD Statistics 2026. Psychology.com. https://psychology.com/ptsd-statistics/
References
- National Institute of Mental Health. (n.d.). Post-traumatic stress disorder (PTSD): Statistics. NIMH. Source.
- National Center for PTSD. (2026). How common is PTSD in adults? U.S. Department of Veterans Affairs. Source.
- National Center for PTSD. (2026). Epidemiology and impact of PTSD. U.S. Department of Veterans Affairs. Source.
- National Center for PTSD. (2026). How common is PTSD in veterans? U.S. Department of Veterans Affairs. Source.
- Koenen, K. C., et al. (2017). Posttraumatic stress disorder in the World Mental Health Surveys. Psychological Medicine. Source.
- Kessler, R. C., et al. (2017). Trauma and PTSD in the WHO World Mental Health Surveys. European Journal of Psychotraumatology. Source.
- Blackmore, R., et al. (2020). The prevalence of mental illness in refugees and asylum seekers: A systematic review and meta-analysis. PLOS Medicine. Source.
- Na, P. J., Schnurr, P. P., & Pietrzak, R. H. (2023). Mental health of U.S. combat veterans by war era. Journal of Psychiatric Research. Source.
- Berger, W., et al. (2012). Rescuers at risk: A systematic review and meta-regression analysis. Social Psychiatry and Psychiatric Epidemiology. Source.
- Stanley, I. H., et al. (2015). Career prevalence and correlates of suicidal thoughts and behaviors among firefighters. Journal of Affective Disorders. Source.
- Cloitre, M., et al. (2019). ICD-11 posttraumatic stress disorder and complex posttraumatic stress disorder in the United States: A population-based study. Journal of Traumatic Stress. Source.
- National Center for PTSD. (2025). Complex PTSD: History and definitions. U.S. Department of Veterans Affairs. Source.
- Swedo, E. A., et al. (2023). Prevalence of adverse childhood experiences among U.S. adults: BRFSS, 2011 to 2020. MMWR. Source.
- Davis, L. L., et al. (2022). The economic burden of posttraumatic stress disorder in the United States from a societal perspective. Journal of Clinical Psychiatry. Source.
- Rytwinski, N. K., et al. (2013). The co-occurrence of major depressive disorder among individuals with posttraumatic stress disorder: A meta-analysis. Journal of Traumatic Stress. Source.
- National Center for PTSD. (2025). Treatment of co-occurring PTSD and substance use disorder in VA. U.S. Department of Veterans Affairs. Source.
- Edmondson, D., et al. (2013). Posttraumatic stress disorder and risk for coronary heart disease: A meta-analytic review. American Heart Journal. Source.
- Akbar, R., et al. (2023). Posttraumatic stress disorder and risk of suicidal behavior: A systematic review and meta-analysis. Suicide and Life-Threatening Behavior. Source.
- Morina, N., et al. (2014). Remission from post-traumatic stress disorder in adults: A systematic review and meta-analysis of long term outcome studies. Clinical Psychology Review. Source.
- Bisson, J. I., et al. (2013). Psychological therapies for chronic post-traumatic stress disorder (PTSD) in adults. Cochrane Database of Systematic Reviews. Source.
- Lewis, C., et al. (2020). Dropout from psychological therapies for post-traumatic stress disorder (PTSD) in adults: Systematic review and meta-analysis. European Journal of Psychotraumatology. Source.
- Stein, D. J., et al. (2020). Perceived helpfulness of treatment for post-traumatic stress disorder: Findings from the World Mental Health Surveys. Depression and Anxiety. Source.
- Goldberg, S. B., et al. (2019). Mental health treatment delay: A comparison among civilians and veterans of different service eras. Psychiatric Services. Source.
- Wisco, B. E., et al. (2022). Posttraumatic stress disorder in US military veterans: Results from the 2019 to 2020 NHRVS. Journal of Clinical Psychiatry. Source.
- Pietrzak, R. H., et al. (2026). National trends in posttraumatic stress disorder among US military veterans: Results from the 2025 to 2026 NHRVS. Journal of Clinical Psychiatry. Source.
- Arena, A. F., et al. (2025). Global PTSD prevalence among active first responders and trends over recent years. Clinical Psychology Review. Source.
- University of Alabama at Birmingham. (June 24, 2024). PTSD and ASD diagnoses rise among college students, new UAB research shows. UAB News. Source.
- U.S. Department of Veterans Affairs. (February 5, 2026). VA releases annual veteran suicide prevention report, updated with 2023 data. VA News. Source.
- Journal of Clinical Psychiatry. (2026). Publisher questions and answers for Pietrzak and colleagues’ National Trends in Posttraumatic Stress Disorder Among US Military Veterans, published May 25, 2026. Sex and age subgroup results from NHRVS 2025 to 2026. psychiatrist.com
More statistics and related pages
Talk it through with a licensed therapist
PTSD can affect work, relationships and everyday routines. Psychology.com’s therapist directory connects people with licensed professionals, including therapists who work with trauma.
This page is educational information, not a diagnosis or a substitute for professional care. If you are in crisis, call or text 988 (U.S. Suicide & Crisis Lifeline), any time.