
 By
By Reviewed by
CDC reported postpartum depressive symptoms in 13.2% of respondents across participating PRAMS sites in 2018. That survey estimate describes symptoms after a live birth, while screening results and diagnoses recorded in care answer different questions. U.S. surveillance provides the starting point, followed by international research and family outcomes, with older evidence dated and broader perinatal conditions identified separately.
Last full review: September 16, 2026 · sourced from CDC surveillance, NIMH, FDA, USPSTF and peer-reviewed research.
Ten numbers that define postpartum depression in 2026
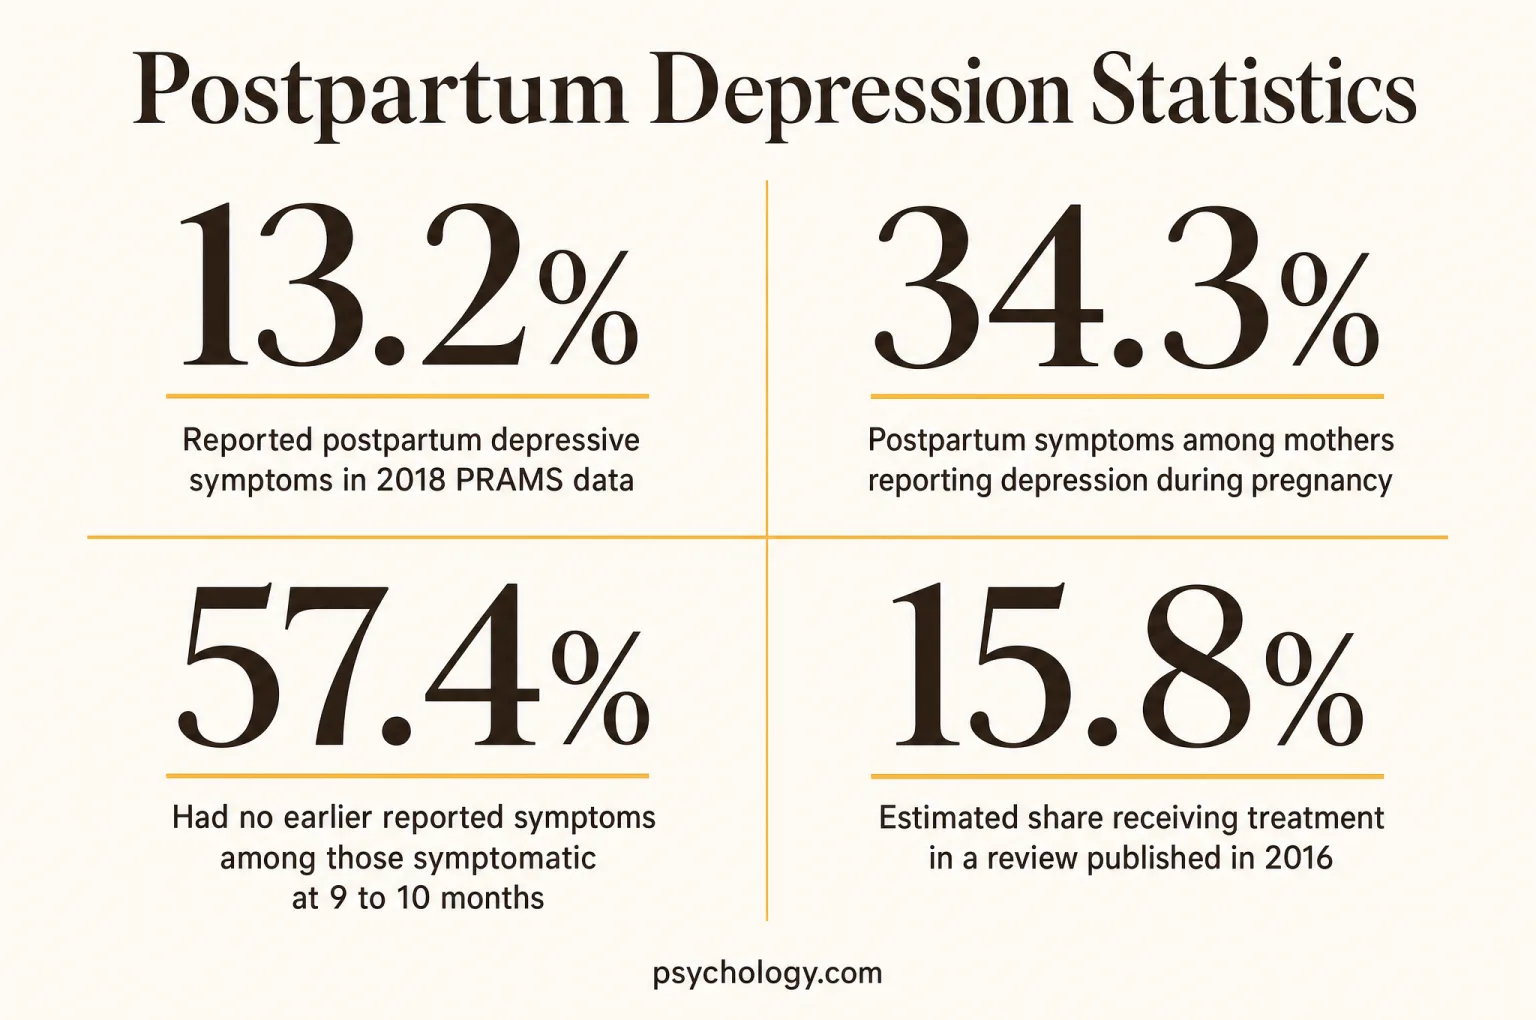
- 13.2% of respondents reported postpartum depressive symptoms in 2018 across participating CDC PRAMS sites, showing a substantial need beyond diagnosed cases. CDC, 2020
- 17.22% was the pooled postpartum depression estimate in Wang and colleagues’ global review published in 2021, with substantial differences between settings and methods. Wang et al., 2021
- 34.3% of mothers reporting depression during pregnancy also reported postpartum symptoms in 2018 PRAMS data, linking need across the birth transition. CDC, 2020
- 57.4% of respondents with depressive symptoms at 9 to 10 months had not reported symptoms earlier in CDC’s seven-state 2019 PRAMS follow-up study. CDC, 2023
- Luca and colleagues estimated in 2020 that untreated perinatal mood and anxiety disorders carried an estimated $14 billion cost for the 2017 U.S. birth cohort through five years postpartum. Luca et al., 2020
- 22.7% of pregnancy-related deaths with an identified underlying cause were attributed to mental health conditions in CDC committee reviews from 36 U.S. states covering 2017 to 2019. CDC Maternal Mortality Review Committees
- Cox and colleagues’ review published in 2016 estimated that 15.8% of women with postpartum depression received treatment, illustrating losses between recognition and care. Cox et al., 2016
- Preventive counseling was associated with a 39% relative reduction in perinatal depression likelihood in the USPSTF evidence reviewed in 2019. USPSTF, 2019
- Zuranolone became the first oral medication FDA-approved specifically for postpartum depression on August 4, 2023, adding a distinct treatment option. FDA, 2023
- 8.75% was the pooled paternal depression estimate within the postpartum year in Rao and colleagues’ review published in 2020, extending the picture to fathers. Rao et al., 2020
How common postpartum depression is
A useful prevalence estimate starts with who was counted and how depression was measured. U.S. birth surveillance asks mothers about symptoms; clinical studies may use screening scales or diagnostic interviews. International averages bring together still more settings, so the same percentage can carry a different meaning depending on its source.
Reported postpartum depressive symptoms in 2018 PRAMS data
CDC analyzed responses across 31 participating Pregnancy Risk Assessment Monitoring System sites and found that postpartum depressive symptoms were common after a live birth. The percentage describes a survey measure of depressed mood or loss of interest, rather than a count of confirmed diagnoses. Participating sites do not constitute a census of every U.S. birth, and experiences outside the survey population may differ. The finding establishes the scale of reported distress in the population that surveillance reached.
- About 1 in 8CDC public summary of 2018 postpartum symptom data
CDC uses this rounded description for women with a recent live birth, linking to the 2020 report of 2018 PRAMS data. It is a summary of historical surveillance, rather than a separate prevalence measurement for 2026.
- 9.7% to 23.5%Range across participating sites in 2018
Illinois and Mississippi marked the reported endpoints, showing substantial geographic variation within the same surveillance framework and year.
- 17.22%Pooled global estimate in a review published in 2021
Wang and colleagues combined historical postpartum studies across settings, so this estimate represents a research synthesis with varied definitions and observation periods.
- 565 studiesEvidence contributing to the 2021 global review
The review included 1,236,365 women from 80 countries or regions, providing wide geographic coverage while retaining differences in sampling and measurement between studies.
- 14.0%Positive depression screens in a study published in 2013
Wisner and colleagues screened 10,000 mothers and identified 1,396 positive results, illustrating how screening identifies a group needing more detailed assessment.
- 1 in 7Broader perinatal depression estimate cited by ACOG in 2018
The committee opinion covered depression during pregnancy and after childbirth, so its frequently quoted estimate has a broader window than postpartum symptoms alone.
| Measure | Figure | Meaning and source |
|---|---|---|
| Edinburgh Postnatal Depression Scale | 16.86% | A questionnaire-based estimate depends on the threshold used to define elevated symptoms. Wang et al. (PMC) |
| Structured Clinical Interview | 10.11% | Interview-based diagnoses draw on a different assessment process and different study samples. Wang et al. (PMC) |
| Postpartum Depression Screening Scale | 37.23% | This pooled result comes from another instrument and cannot be read as a head-to-head test comparison. Wang et al. (PMC) |
Why the estimates should remain separate
A positive questionnaire result indicates possible depression, while a diagnosis adds clinical assessment and consideration of other explanations. Studies also differ in how long after delivery they ask questions and whether they count symptoms at one visit or across an entire period. In the 2021 global review, the differences between instruments were substantial enough to change the apparent prevalence. A country ranking can therefore reflect screening practice and study selection as well as differences in population health. Postpartum Support International also describes a broader combined burden of depressive and anxiety symptoms; that grouping should retain its original definition when quoted. Its information on perinatal conditions helps explain why estimates of all postpartum mental health difficulties often sit above estimates of depression alone.
Psychology.com’s postpartum depression screening questionnaire provides a related way to understand symptom questions; a score has a different purpose from a population prevalence estimate.
Who is most affected
Postpartum depressive symptoms appear across demographic groups, but surveillance shows unequal burdens. Age, previous depression, insurance and exposure to violence are associated with different rates. These comparisons describe groups within a survey; they do not establish a single cause or determine what will happen to an individual mother.
Postpartum symptoms among mothers reporting depression during pregnancy
In 2018 PRAMS data, postpartum depressive symptoms were reported by about a third of mothers who also reported depression during pregnancy. That association connects mental health needs before and after birth. Because both measures were self-reported, it does not establish which respondents had a diagnosed episode or whether symptoms continued uninterrupted. A previous difficulty can help explain a group’s higher prevalence without making a particular person’s future predictable.
- 22.2%Mothers aged 19 or younger, 2018
The youngest PRAMS age group had the highest symptom prevalence among the reported age bands, highlighting the needs of mothers entering parenthood during adolescence.
- 17.8%Mothers aged 20 to 24, 2018
Symptoms remained common in the next age band, extending the higher observed burden beyond teenage mothers.
- 11.9%Mothers aged 25 to 34, 2018
The lower prevalence in this age group still represents substantial distress, illustrating why attention to symptoms cannot be confined to the youngest parents.
- 10.8%Mothers aged 35 or older, 2018
The oldest reported age group had the lowest of these age-specific estimates, while still showing a meaningful burden after childbirth.
- 17.2% vs 10.1%Medicaid compared with private insurance at delivery, 2018
PRAMS respondents covered by Medicaid reported more symptoms, but insurance category also reflects differences in income and circumstances that this comparison cannot separate.
- 33.1%Reported intimate partner violence before or during pregnancy, 2018
The symptom prevalence in this group underscores the overlap between violence exposure and maternal distress, without assigning responsibility to the person experiencing violence.
- 3.8%Massachusetts symptoms at 9 to 10 months postpartum, 2019 follow-up
This was the lowest state estimate in the seven-state CDC follow-up, providing a dated local measure for readers searching for postpartum depression by state.
CDC, Timing of Postpartum Depressive Symptoms (November 9, 2023)
- 12.4%West Virginia symptoms at 9 to 10 months postpartum, 2019 follow-up
This was the highest estimate in the same follow-up; the selected states and later assessment window limit comparisons with national or early-postpartum rates.
CDC, Timing of Postpartum Depressive Symptoms (November 9, 2023)
| Measure | Figure | Meaning and source |
|---|---|---|
| White, non-Hispanic | 11.4% | These categories describe respondents’ reported identities within the surveillance sample. CDC MMWR table |
| Black, non-Hispanic | 18.2% | The observed disparity is a population finding rather than evidence of an inherent biological difference. CDC MMWR table |
| Hispanic | 12.0% | A broad category can contain substantial differences in language, background and circumstances. CDC MMWR table |
| American Indian or Alaska Native, non-Hispanic | 22.0% | The estimate has greater uncertainty than results from larger survey groups. CDC MMWR table |
| Asian or Pacific Islander, non-Hispanic | 19.2% | Combining communities can obscure important differences within the reported category. CDC MMWR table |
What subgroup differences can explain
The 2018 PRAMS report places these comparisons within a common survey framework, which makes them more informative than figures drawn from unrelated studies. They remain observational associations. Differences in previous mental health, economic security, care access and lived experiences may overlap, and a broad demographic label cannot isolate their effects. The survey also focuses on women with a recent live birth, limiting how far its findings extend to other reproductive experiences.
Psychology.com’s resources on women’s issues offer related context for the circumstances surrounding pregnancy and parenthood.
Onset, symptoms and duration
The period after delivery includes early symptoms, persistent difficulties and episodes first recognized much later. An early survey captures only part of that experience. Studies following the same mothers over time are especially useful because they can distinguish changing symptom patterns from differences between separate groups of respondents.
Had no earlier reported symptoms among those symptomatic at 9 to 10 months
In a study using 2019 PRAMS follow-up data from seven states selected for high opioid-related mortality, more than half of respondents with symptoms at the later survey had not reported them at the earlier assessment, completed 2 to 6 months postpartum. The later survey ran from October 2019 through April 2020. These responses do not pinpoint when depression began. Symptoms could emerge or fluctuate between contacts, but the result shows why an early snapshot cannot describe mental health throughout the rest of the postpartum year.
- 11.9%Symptoms at 2 to 6 months postpartum, 2019 PRAMS study
The earlier survey established the initial symptom burden in the participating PRAMS follow-up population, providing a reference for the later assessment.
- 7.2%Symptoms at 9 to 10 months postpartum, 2019 PRAMS study
A lower overall prevalence later in the year still included respondents whose earlier screening responses had been reassuring.
- 3.1%Symptoms reported at both assessments, 2019 PRAMS study
Repeated positive responses identified a group with difficulties at both survey points, although the study could not establish uninterrupted symptoms between them.
- 68.5%Previous depression among respondents symptomatic at both assessments, 2019 PRAMS study
Most in this repeatedly symptomatic group reported depression before or during pregnancy, connecting longer-running needs with their postpartum experience.
- 4 to 8 weeksCommon early onset window described by NIMH
NIMH places the beginning of most perinatal depression episodes in this period after birth, while recognizing that symptoms may arise during pregnancy or later.
- First 2 weeksBaby blues timing described by NIMH
The brief mood changes commonly called baby blues occur in this early window, which distinguishes that description from longer-lasting depressive illness.
| Measure | Figure | Meaning and source |
|---|---|---|
| After childbirth | 40.1% | Wisner and colleagues found that postpartum onset was the largest individual category. Wisner et al. (PubMed) |
| During pregnancy | 33.4% | A substantial share of episodes had begun before delivery. Wisner et al. (PubMed) |
| Before pregnancy | 26.5% | Some episodes predated pregnancy, showing that postpartum detection and postpartum onset are different measures. Wisner et al. (PubMed) |
Symptom patterns can continue beyond infancy
A trajectory study published in 2020 followed 4,866 mothers in the Upstate KIDS cohort, measuring symptoms at 4, 12, 24 and 36 months postpartum and identified low-stable (74.7%), medium-decreasing (12.6%), low-increasing (8.2%) and high-persistent (4.5%) patterns. These are groups formed from repeated symptom scores, rather than diagnosed episode lengths. The increasing and persistent patterns show why a single average duration would conceal different experiences. Anxiety can also accompany depression: the Wisner study published in 2013 found anxiety disorders in almost two-thirds of the diagnostically evaluated screen-positive group. Changes in symptoms and overlap with other conditions both complicate a simple timeline.
Anxiety and psychosis are distinct outcomes
A meta-analysis published in 2017 estimated self-reported anxiety symptoms at 15.0% during 1 to 24 weeks postpartum, illustrating a related burden that can overlap with depression. A separate systematic review published in 2017 found postpartum psychosis incidence ranging from 0.89 to 2.6 per 1,000 women across five studies, without pooling them into one global rate. These estimates concern different conditions and methods, so adding them to a depression percentage would count some people more than once and mix incompatible measures. Psychosis is a separate, uncommon condition; its incidence should not be presented as the proportion of mothers with depression who develop psychotic symptoms.
For recording changes over time, Psychology.com’s daily diary card offers a place to organize personal observations. A personal record has a different purpose from a research questionnaire and cannot establish a diagnosis or determine how common depression is among parents.
Impact: mothers, infants and cost
Depression can affect daily functioning and family relationships, while broader perinatal mental health difficulties carry substantial health and economic costs. The strongest interpretation keeps each outcome separate: a model estimates spending and productivity losses, a cohort tracks child outcomes, and mortality committees review deaths linked to pregnancy.
Estimated cost of untreated perinatal mood and anxiety disorders for 2017 births
Luca and colleagues modeled costs from conception through five years postpartum for the 2017 U.S. birth cohort. The estimate covers untreated perinatal mood and anxiety disorders together, extending beyond postpartum depression alone. It includes consequences for mothers and children over several years, so it cannot be described as annual postpartum depression spending or as a bill paid by families. The model was published in 2020 and retains its original economic assumptions.
- About $31,800Estimated cost per affected mother-child pair, 2017 birth cohort
This modeled average combines multiple consequences over the study horizon and does not predict an individual family’s expenses or income losses.
- 65%Maternal share of modeled costs, 2017 birth cohort
Most estimated costs were associated with mothers, including productivity losses and health care spending attributable to untreated perinatal mood and anxiety disorders.
- 35%Child share of modeled costs, 2017 birth cohort
The child component extends the economic picture beyond maternal care, while depending on the model’s assumptions about links between maternal conditions and child outcomes.
- 22.7%Mental health conditions among identified causes of pregnancy-related death, 2017 to 2019
In reviews from 36 U.S. states, 224 of 987 deaths with an identified cause fell in the mental health category. It includes suicide and substance-use-related deaths, so the share cannot be attributed specifically to postpartum depression.
- 84.2%Reviewed pregnancy-related deaths judged preventable, 2017 to 2019
This percentage concerns deaths with a preventability determination across causes, expressing opportunities for prevention beyond the mental health category alone.
- 53%Pregnancy-related deaths with known timing occurring 7 to 365 days postpartum, 2017 to 2019
Across 36 states, this rounded share excluded deaths with missing or unknown timing. It spans causes and shows that pregnancy-related mortality extends beyond delivery and the immediate hospital stay.
| Measure | Figure | Meaning and source |
|---|---|---|
| Maternal productivity losses | $4,635 million | Lost economic output formed a major part of the estimated burden. Luca et al. (PMC) |
| Maternal health care spending | $3,449 million | Health care accounted for another substantial component across the model’s time horizon. Luca et al. (PMC) |
| Preterm birth | $2,940 million | This modeled infant-related component reflects the evidence and assumptions used by the authors. Luca et al. (PMC) |
| Child emergency department visits | $197 million | The estimate captures one type of downstream health service use. Luca et al. (PMC) |
Child outcomes describe associations across families
In a cohort analysis published in 2018, persistent severe postnatal depressive symptoms, measured with the EPDS at both 2 and 8 months, were associated with child behavioral problems at age 3.5 years, with an odds ratio of 4.84. An odds ratio compares odds between groups; it does not give the percentage of children who will develop difficulties. Shared circumstances and other factors can influence both maternal symptoms and child outcomes, and an observational study cannot fully separate them. These findings describe support needs across families without predicting a child’s future or assigning blame to a parent.
The parenting resources on Psychology.com provide related context for family life and relationships.
Screening, treatment and the care gap
Recognition, assessment, starting treatment and getting effective ongoing care are separate stages. A high rate of conversations about mood can coexist with substantial unmet need. Historical treatment estimates show where people were lost along that path, while screening research explains why a questionnaire result needs a next step.
Estimated share receiving treatment in a review published in 2016
Cox and colleagues synthesized a postpartum depression treatment cascade, estimating that 30.8% of affected women were identified and 15.8% received treatment. These stages drew on evidence across studies rather than tracking a single national cohort from screening to recovery. The figures make the gap between recognition and care visible, but their age and design prevent treating them as a current U.S. treatment rate. Receiving some care also differs from receiving adequate treatment.
- 79.1%Asked about depression during prenatal care, 2018
Among PRAMS respondents who received prenatal care, this share recalled a provider asking about depression. It measures a conversation rather than completion of a validated screening instrument or subsequent treatment.
- 87.4%Asked about depression at postpartum visits, 2018
Among respondents who attended a postpartum visit, this share recalled being asked about depression. Contact at a visit does not show whether a symptomatic patient received further assessment.
- 6.3%Estimated adequate treatment in the 2016 cascade review
This smaller share used the review’s definition of adequate care, showing another loss beyond simply recording that treatment had begun.
- 3.2%Estimated remission through the 2016 treatment cascade
This estimate describes the proportion reaching remission through the modeled care pathway and should not be presented as the overall chance of recovery.
- 39%Relative reduction associated with preventive counseling, 2019 evidence
The USPSTF review found a relative risk of 0.61 for perinatal depression, an outcome about prevention among study participants rather than treatment of established illness.
- 0.85 / 0.84EPDS sensitivity and specificity at a cutoff of 10 or higher, 2020 review
Against semistructured diagnostic interviews, the screening tool’s accuracy left both missed cases and positive results without major depression, demonstrating the role of further assessment.
| Measure | Figure | Meaning and source |
|---|---|---|
| Number needed to treat | 13.5 | This estimate assumes a 19% baseline risk, the median control-group risk in the included studies; it changes when baseline risk changes. USPSTF |
| Mothers and Babies program | 53% | Pooled relative risk reduction summarizes the relevant prevention trials. USPSTF |
| ROSE program | 50% | This separate pooled reduction is also relative, so it should not be read as a percentage-point change. USPSTF |
Screening becomes useful through follow-up
The USPSTF recommendation issued on June 20, 2023 gives adult depression screening a Grade B recommendation and explicitly includes pregnant and postpartum persons. Its pathway to benefit connects a positive screen with diagnostic evaluation and appropriate care. That distinction helps explain why discussion rates cannot substitute for treatment outcomes. In the study published by Wisner and colleagues in 2013, 22.6% of diagnostically evaluated women with positive depression screens had bipolar disorders. The finding illustrates the diagnostic variety within a screen-positive group and does not mean that the same proportion of all postpartum mothers has bipolar disorder.
People looking for professional support can use the Psychology.com directory to find a licensed therapist. The behavioral activation worksheet provides a related way to record activities and mood for discussion; population treatment statistics cannot determine which form of care fits an individual parent.
Research and treatment milestones
Research published since 2019 has documented more cases identified in medical records in a large health system, a new oral medication approval and continuing gaps between screening and care. Publication dates and observation years differ. These developments provide useful milestones, while a continuous national prevalence series through 2026 remains outside this evidence.
Postpartum depression identified in medical records increased between 2010 and 2021
A study published in 2024 examined 442,308 pregnancies ending in live births or stillbirths at 20 or more weeks in Kaiser Permanente Southern California. Cases were identified through depression diagnosis codes or antidepressants prescribed for postpartum depression within 12 months after birth. The proportion rose from 9.4% to 19.0%. This measure describes one health system, where changes in symptoms, recognition, screening and recording can affect case identification. It cannot establish a national increase in clinically diagnosed depression.
- 3.6% to 13.8%Asian or Pacific Islander patients, 2010 to 2021
The increase in cases identified from diagnosis or prescribing records began from a comparatively low baseline, illustrating why starting levels matter when comparing changes across groups.
- 9.2% to 22.0%Non-Hispanic Black patients, 2010 to 2021
Cases identified from diagnosis or prescribing records increased substantially in this health-system group, alongside the broader upward pattern documented in the study.
- 8.9% to 18.8%Hispanic patients, 2010 to 2021
The higher endpoint concerns cases identified in medical records, so it should remain separate from questionnaire-based estimates in birth surveillance.
- 13.5% to 21.8%Non-Hispanic White patients, 2010 to 2021
Cases identified in medical records increased from an already higher baseline, providing another example of the difference between initial levels and subsequent change.
- 14 daysZuranolone course described at FDA approval on August 4, 2023
The first oral medication specifically approved for postpartum depression was evaluated as a short treatment course, a milestone that does not itself measure population access.
- -15.6 vs -11.6Depression score changes in a severe PPD trial published in 2023
At day 15, the adjusted mean HAM-D improvement was greater with zuranolone than placebo, with a between-group difference of -4.0 points.
Trial results and population change answer different questions
The 2023 zuranolone trial randomized 196 women with severe postpartum depression, and 86.7% completed the 45-day study. Those results describe efficacy and participation under trial conditions; they do not establish how many eligible patients obtain treatment or remain well over subsequent years. The FDA approval announcement reported that the treatment effect was maintained at day 42. Separately, CDC committee data for 2020 from 38 states attributed 22.5% of pregnancy-related deaths with an identified cause to mental health conditions. CDC cautions that committee reports from different years should not be directly compared. This mortality measure also comes from a different population than the health-system records. Changes in these separate indicators cannot be assembled into a single postpartum depression trend.
The 2019 USPSTF prevention recommendation and the 2023 depression screening recommendation concern different points in care: reducing the likelihood of depression and recognizing possible existing illness. Their publication dates mark changes in guidance, rather than dates when a measured population outcome necessarily improved.
Fathers and partners
Depression around childbirth also affects fathers, whose symptoms may develop during pregnancy or across the postpartum year. Research on fathers helps describe family needs, while leaving gaps for other partners and family structures. Estimates depend on the screening tool, study setting and the timing of assessment after birth.
Pooled paternal depression prevalence within the postpartum year
A meta-analysis published in 2020 combined observational surveys of fathers and estimated postpartum depression prevalence across the year after birth. The wider review included 47 studies and 20,728 participants, with a prenatal depression estimate of 9.76%. Those are separate time windows with potentially overlapping people. They cannot be added to produce the share ever affected, and the pooled figures are historical research estimates rather than a survey of fathers in 2026.
- 8.98%Within the first postpartum month, review published in 2020
The early estimate shows that paternal symptoms may already be present during the newborn period.
- 7.82%Between 1 and 3 months postpartum, review published in 2020
A lower pooled estimate in this window reflects the included studies and does not track recovery among the same individual fathers.
- 9.23%Between 3 and 6 months postpartum, review published in 2020
The pooled estimate in this window shows symptoms beyond the earliest months. It summarizes separate study samples and does not measure persistence in the same fathers over time.
- 8.40%Between 6 and 12 months postpartum, review published in 2020
The later estimate extends paternal depression research across the remainder of the postpartum year.
- 8.4%Paternal perinatal depression in a review published in 2016
This earlier synthesis covered 74 studies and 41,480 participants across pregnancy and postpartum, a broader window than postpartum-only estimates.
- 10.4%Paternal perinatal depression in a review published in 2010
The estimate from 43 studies is another historical synthesis, whose difference from later reviews should not be interpreted as a measured decline over time.
| Measure | Figure | Meaning and source |
|---|---|---|
| History of mental illness | OR 3.48 | The association links earlier mental health difficulties with higher postpartum depression odds. Wang et al., J Affect Disord (PubMed) |
| Unemployment | OR 2.59 | Employment circumstances were associated with symptoms across the reviewed studies. Wang et al., J Affect Disord (PubMed) |
| Financial strain | OR 2.07 | Financial difficulty showed an association beyond a simple description of parental role. Wang et al., J Affect Disord (PubMed) |
| Low marital satisfaction | OR 1.40 | Lower marital satisfaction was associated with paternal depression; the review cannot establish the direction of causation. Wang et al., J Affect Disord (PubMed) |
| Maternal postnatal depression | OR 1.17 | Symptoms in the other parent were associated with paternal depression, without establishing a single direction of causation. Wang et al., J Affect Disord (PubMed) |
Family associations do not determine a child’s future
In a population study published in 2005, paternal depressive symptoms assessed with the EPDS at eight weeks postpartum were associated with child emotional or behavioral problems at age 3.5 years, with an adjusted odds ratio of 2.09. Adjustment accounts for measured factors while leaving room for unmeasured influences. As with maternal research, the result concerns group differences and cannot predict the outcome for an individual child. The studies summarized here largely identify participants as fathers; extending their rates to non-birthing partners of every gender, adoptive parents or other caregivers would require evidence specific to those groups.
Common questions
How common is postpartum depression?
CDC found that 13.2% of respondents reported postpartum depressive symptoms across participating PRAMS sites in 2018. Its public information page summarizes those 2018 data as about 1 in 8 women with a recent live birth. Those figures concern symptoms reported by mothers, and a clinical diagnosis requires further assessment. A global review published in 2021 pooled an estimate of 17.22%, with different countries, tools and follow-up windows contributing to the result. Neither figure measures the prevalence specifically in 2026. CDC surveillance; global review.
Can postpartum depression begin later in the first year?
Yes. In a follow-up study using 2019 PRAMS data from seven states, 7.2% reported depressive symptoms at 9 to 10 months postpartum. Among that group, 57.4% had not reported symptoms at the earlier survey, completed 2 to 6 months after birth. A later positive screen does not establish the exact day an episode began, because symptoms could change between surveys. The finding shows why a reassuring early result cannot describe the whole postpartum year or settle what a mother experiences later. CDC follow-up study.
How long does postpartum depression last?
There is no single duration that describes everyone. A study published in 2020 identified both decreasing and increasing symptom patterns through three years postpartum, alongside a smaller group with persistently high symptoms. That design tracks changes over time rather than measuring the length of every depressive episode. NIMH distinguishes depression from the brief baby blues often experienced in the first two weeks after birth. Symptoms, previous history, treatment and follow-up all affect what a duration estimate means, so study averages cannot predict an individual course. trajectory study; NIMH.
What do screening and treatment statistics measure?
Screening statistics describe a step in recognizing possible depression; treatment statistics describe what follows. The 2023 USPSTF recommendation includes pregnant and postpartum adults in depression screening and emphasizes further evaluation and access to appropriate care after a positive result. A treatment cascade review published in 2016 estimated that 15.8% of women with postpartum depression received treatment. That historical estimate combines evidence across studies and cannot establish the care gap in 2026. A screening score also cannot identify which treatment a particular person needs. USPSTF; treatment cascade review.
Can fathers and partners experience postpartum depression?
Fathers can experience depression during pregnancy and after a baby is born. A review published in 2020 estimated paternal depression prevalence at 8.75% within the postpartum year, with results varying across follow-up windows. These studies largely describe fathers and do not establish a separate prevalence for every kind of partner or family. Associations with financial strain, previous mental illness and maternal depression show that family circumstances matter, while each parent still has a distinct experience. The evidence supports including fathers in the mental health picture. Rao and colleagues; risk-factor review.
How do postpartum depression statistics relate to suicide risk?
CDC maternal mortality reviews group several mental health conditions together, including deaths by suicide and deaths related to substance use disorder. Their percentages describe causes among pregnancy-related deaths, so they cannot tell us the chance that a mother with postpartum depression will die by suicide. These are different populations and outcomes. Depression is treatable, and support is available. If you or someone you know is thinking about suicide, call or text 988 in the United States to reach the Suicide & Crisis Lifeline. CDC maternal mortality review; NIMH.
How we compiled this
Figures were selected from CDC surveillance, federal publications, original studies and systematic reviews, using a saved source bank with quotations and linked records. Older findings retain their observation year or, for pooled historical research, their publication year. Symptoms, diagnoses, odds ratios and estimated costs are labeled separately. Studies with different populations or screening thresholds are described independently, without creating a combined prevalence or annual trend. Economic figures retain the original birth cohort and time horizon. References link to the source pages or corresponding PubMed records when abstracts supplied the evidence. Untraceable claims and inaccessible source figures were excluded. Source pages were fetched again on September 16, 2026. The current CDC maternal mortality landing page did not expose its data table in the fetched text, so historical mortality figures remain dated to their original cohorts. The added state estimates concern later postpartum symptoms in selected states and do not establish current state rankings. Last full review: September 16, 2026.
Journalists and researchers may reuse any statistic with attribution to the original source and a link to Psychology.com.
Cite this source
Fontane Pennock, S. (2026, September 13). Postpartum Depression Statistics 2026. Psychology.com. https://psychology.com/postpartum-depression-statistics/
References
- Centers for Disease Control and Prevention. (2024). Symptoms of depression among women. Source record
- Bauman, B. L., et al. (2020). Vital Signs: Postpartum depressive symptoms and provider discussions about perinatal depression, United States, 2018. Morbidity and Mortality Weekly Report. Source record
- Robbins, C. L., et al. (2023). Timing of postpartum depressive symptoms. Preventing Chronic Disease. PRAMS follow-up, 2019 data. Source record
- Postpartum Support International. (n.d.). About perinatal mental health. Source record
- U.S. Preventive Services Task Force. (February 12, 2019). Perinatal depression: Preventive interventions. Final recommendation statement. Source record
- American College of Obstetricians and Gynecologists. (2018). ACOG Committee Opinion No. 757: Screening for perinatal depression. Obstetrics & Gynecology. Source record
- U.S. Food and Drug Administration. (August 4, 2023). FDA approves first oral treatment for postpartum depression. Source record
- Deligiannidis, K. M., et al. (2023). Zuranolone for the treatment of postpartum depression. American Journal of Psychiatry. Source record
- Wang, Z., et al. (2021). Mapping global prevalence of depression among postpartum women. Translational Psychiatry. Source record
- Wisner, K. L., et al. (2013). Onset timing, thoughts of self-harm, and diagnoses in postpartum women with screen-positive depression findings. JAMA Psychiatry. Source record
- Cox, E. Q., et al. (2016). The perinatal depression treatment cascade: Baby steps toward improving outcomes. Journal of Clinical Psychiatry. Source record
- Luca, D. L., et al. (2020). Financial toll of untreated perinatal mood and anxiety disorders among 2017 births in the United States. American Journal of Public Health. Source record
- Centers for Disease Control and Prevention. (n.d.). Pregnancy-related deaths: Data from Maternal Mortality Review Committees in 36 U.S. states, 2017 to 2019. Archived report. Source record
- Centers for Disease Control and Prevention. (n.d.). Pregnancy-related deaths: Data from Maternal Mortality Review Committees, 2020. Archived report. Source record
- Khadka, N., et al. (2024). Trends in postpartum depression by race, ethnicity, and prepregnancy body mass index. JAMA Network Open. Source record
- Paulson, J. F., & Bazemore, S. D. (2010). Prenatal and postpartum depression in fathers and its association with maternal depression: A meta-analysis. JAMA. Source record
- Cameron, E. E., Sedov, I. D., & Tomfohr-Madsen, L. M. (2016). Prevalence of paternal depression in pregnancy and the postpartum: An updated meta-analysis. Journal of Affective Disorders. Source record
- Rao, W. W., et al. (2020). Prevalence of prenatal and postpartum depression in fathers: A comprehensive meta-analysis of observational surveys. Journal of Affective Disorders. Source record
- Wang, D., et al. (2021). Factors influencing paternal postpartum depression: A systematic review and meta-analysis. Journal of Affective Disorders. Source record
- Ramchandani, P., et al. (2005). Paternal depression in the postnatal period and child development: A prospective population study. The Lancet. Source record
- Dennis, C. L., Falah-Hassani, K., & Shiri, R. (2017). Prevalence of antenatal and postnatal anxiety: Systematic review and meta-analysis. British Journal of Psychiatry. Source record
- VanderKruik, R., et al. (2017). The global prevalence of postpartum psychosis: A systematic review. BMC Psychiatry. Source record
- Putnick, D. L., et al. (2020). Trajectories of maternal postpartum depressive symptoms. Pediatrics. Source record
- Netsi, E., et al. (2018). Association of persistent and severe postnatal depression with child outcomes. JAMA Psychiatry. Source record
- Levis, B., et al. (2020). Accuracy of the Edinburgh Postnatal Depression Scale for screening to detect major depression among pregnant and postpartum women: Systematic review and meta-analysis of individual participant data. BMJ. Source record
- National Institute of Mental Health. (2023). Perinatal depression. Source record
- U.S. Preventive Services Task Force. (June 20, 2023). Depression and suicide risk in adults: Screening. Final recommendation statement. Source record
- Robbins, C. L., et al. (November 9, 2023). Timing of postpartum depressive symptoms. Publisher report, including state estimates from the 2019 PRAMS follow-up. CDC, Timing of Postpartum Depressive Symptoms (November 9, 2023)
More statistics and related pages
Talk it through with a licensed therapist
If any of this is close to home, a licensed therapist can help you work out what applies to you. Browse license-verified therapists on the internet's original directory.
This page is educational information, not a diagnosis or a substitute for professional care. If you are in crisis, call or text 988 (U.S. Suicide & Crisis Lifeline), any time.