
 By
By Reviewed by
Pew Research Center found that 40% of U.S. teens ages 13 to 17 were online almost constantly in its 2025 survey, compared with 46% in 2024. Social media addiction is not a separately named DSM-5-TR diagnosis. This page follows the terms used by each source, including problematic use, addictive use and heavy use. Screening estimates, reported habits and measured device activity answer different questions. The figures link to surveys, cohorts, meta-analyses and public reports first checked on September 13, 2026, with the selected annual sources refreshed on September 16, 2026.
Last full review: September 16, 2026 · sourced from Pew Research Center, the CDC, the U.S. Surgeon General, Gallup, WHO, JAMA and peer-reviewed meta-analyses.
Ten numbers that define social media and phone addiction in 2026
- 40% of U.S. teens ages 13 to 17 said they were online almost constantly in Pew Research Center’s 2025 survey, compared with 46% in 2024. Pew Research Center, 2025
- In Gallup’s 2023 survey, U.S. teens ages 13 to 19 reported an average of 4.8 hours a day on social media in 2023, and 51% reported four hours or more. Gallup, 2023
- Meng and colleagues’ 2022 review covering 504 studies of digital addiction estimated 26.99% prevalence for smartphone addiction and 17.42% for social media addiction in the relevant study subsets. Meng et al., Clinical Psychology Review, 2022
- 11% of adolescents in WHO Europe’s 2024 HBSC report ages 11, 13 and 15 surveyed across Europe, central Asia and Canada showed problematic social media use in 2022, up from 7% in 2018. WHO Europe HBSC, 2024
- In Xiao and colleagues’ 2025 JAMA analysis of a U.S. cohort of 4,285 children studied from 2016 to 2022, 31.3% followed an increasing self-reported addictive social media use trajectory, associated with 2.14 times the risk of suicidal behaviors versus the low trajectory. Xiao et al., JAMA, 2025
- In CDC’s 2024 report, among U.S. teens ages 12 to 17 reporting at least four hours of weekday screen time outside schoolwork, 27.1% had recent anxiety symptoms, versus 12.3% below four hours (2021 to 2023). CDC NCHS, 2024
- 41% of U.S. adults said they were online almost constantly in Pew’s 2025 survey, including 63% of 18 to 29 year olds. Pew Research Center, 2026
- Respondents in Reviews.org’s 2026 U.S. consumer-survey report reported 186 phone checks a day, and 45.8% described themselves as addicted to their phone. Reviews.org, 2026
- 45% of U.S. teens in Pew Research Center’s 2025 report said they spent too much time on social media in 2024, up from 36% in 2022. Pew Research Center, 2025
- Education Week reported that as of July 28, 2026, at least 39 states and D.C. required school phone restrictions; 77% of U.S. adults supported in-class bans in middle and high schools in a separate Pew Research Center 2026 poll. Education Week; Pew Research Center, 2026
How common problematic use is
Social media addiction is not a separately named diagnosis in the DSM-5-TR or ICD-11. Prevalence estimates depend on the screening tool, cutoff and population. One U.S. smartphone study requiring functional impairment found rates near 1%. Other screening studies found much higher rates. These studies measure different constructs and cannot establish one universal prevalence.
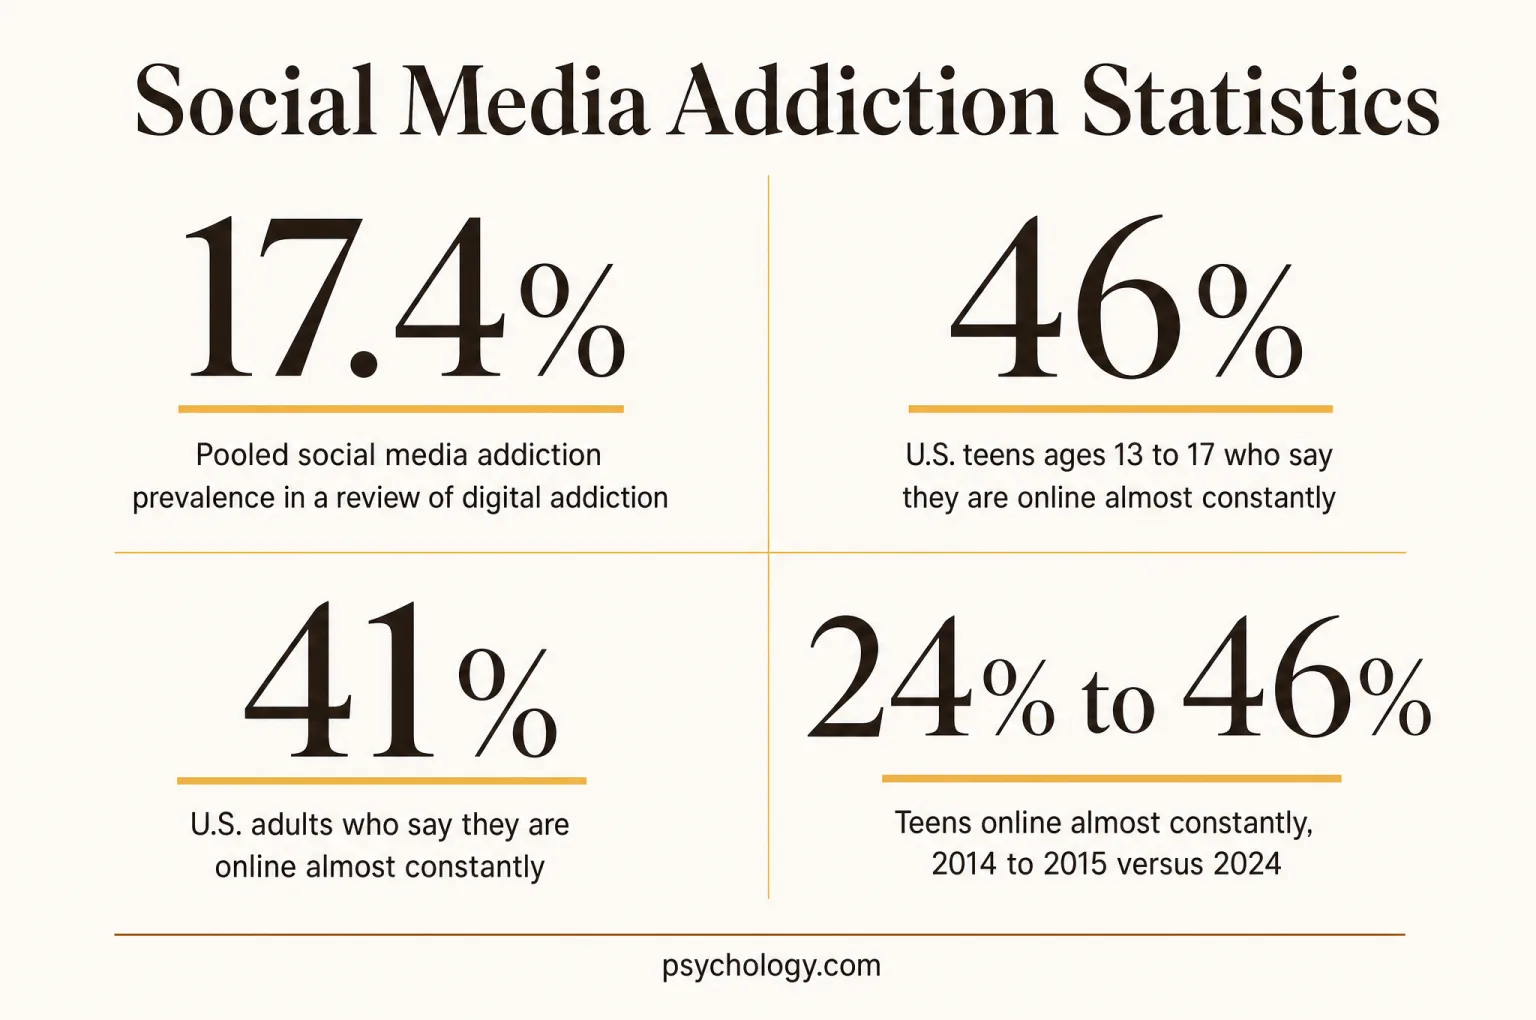
Pooled social media addiction prevalence in a review of digital addiction
Meng and colleagues reviewed research published before October 31, 2021. Across all digital-addiction subtypes, the meta-analysis covered 504 studies, 2,123,762 people and 64 countries. The relevant subsets yielded 17.42% for social media addiction and 26.99% for smartphone addiction. Validated screening tools were required, but tools and cutoffs varied. Higher digital-addiction estimates were found in low and lower-middle income countries, and the authors reported an upward historical trend. Screening results do not establish clinical diagnoses.
- 26.99%Smartphone addiction, pooled global prevalence
The most common form of digital addiction in the same meta-analysis, ahead of internet addiction (14.22%) and game addiction (6.04%). Males had higher risk for internet and game addiction.
- 5% to 25%Social media addiction, depending on how strictly it is defined
Across 63 samples and 34,798 respondents in 32 nations, strict classifications yielded 5%, severe-level cutoffs or strict polythetic classifications 13%, and moderate cutoffs or polythetic classifications 25%. Both classification scheme and cultural context matter when interpreting these estimates.
- 31% vs 14%Prevalence in collectivist versus individualist nations
The same meta-analysis found rates twice as high in collectivist cultures, a reminder that cross-country comparisons need matching tools and cutoffs.
- 0.75% to 1.2%U.S. adults with problematic smartphone use once functional impairment is required
A representative sample of 1,989 adults screened with an impairment criterion. The same paper notes that looser definitions in other studies reach 20% to 30%.
- 11%Adolescents in Europe, central Asia and Canada with problematic social media use
The 2022 HBSC survey covered almost 280,000 adolescents ages 11, 13 and 15 across 44 countries and regions. Problematic social media use was 11%, versus 7% in 2018; girls reported 13% and boys 9%. Risk of problematic gaming was 12% overall, 16% for boys and 7% for girls.
- 45.8%Adults in a U.S. consumer survey who describe themselves as addicted to their phone
This was a self-description in a Reviews.org online survey of about 1,000 adults in late 2025. It did not use the functional-impairment definition in the separate U.S. smartphone study, so the two percentages cannot be treated as equivalent prevalence measures.
How researchers define problematic use
The DSM-5-TR recognizes gambling disorder and identifies internet gaming disorder for further study; ICD-11 recognizes gambling and gaming disorders. Neither separately names social media or smartphone addiction. Researchers commonly assess loss of control, preoccupation and interference with sleep, school, work or relationships using self-report scales. Classification may require every symptom or only a subset, and some studies also require functional impairment. The study definition should accompany any prevalence estimate. Sources: American Psychiatric Association; WHO; Social media use disorder classification review, 2025.
Teens and young adults
Teen surveys measure different aspects of connectivity. Pew’s 2024 survey of 1,391 U.S. teens ages 13 to 17 found nearly half online almost constantly. The CDC’s 2023 high school survey measured frequent social media use, while Gallup asked ages 13 to 19 about hours. Each provides a different view of reported habits. Pew’s newer survey, fielded from September 25 to October 9, 2025, adds a later observation while the earlier survey remains labeled below for comparison.
U.S. teens ages 13 to 17 who say they are online almost constantly in 2024
Pew found the same 46% in 2022 and 2024, compared with 24% in its 2014 to 2015 survey. In 2024, Black (53%) and Hispanic (58%) teens were more likely than White teens (37%) to report being online almost constantly. One third used at least one of the five surveyed platforms almost constantly. Nearly all teens (96%) reported going online daily, and 95% had or had access to a smartphone at home.
- 77.0%High school students who use social media several times a day
The 2023 YRBS surveyed 20,103 U.S. high school students; 15,203 answered the social media item. Frequent use was self-reported by 81.8% of female students and 72.9% of male students.
- 4.8 hoursAverage daily teen time across seven social media apps
Gallup surveyed 1,591 U.S. adolescents ages 13 to 19 in 2023 about their own use: YouTube averaged 1.9 hours, TikTok 1.5 and Instagram 0.9 per day. Girls reported 5.3 hours across seven platforms and boys 4.4; 51% reported four hours or more.
- 45%Teens who say they spend too much time on social media
In the survey conducted in 2024 and published in 2025, 45% said their social media time was excessive, versus 36% in 2022. Separately, 44% said they had cut back on social media.
- 54%Teens who say giving up social media would be at least somewhat hard
Pew's 2022 survey of 1,316 teens; 46% said it would be at least somewhat easy.
- 44%Teens who feel anxious at least sometimes when they do not have their phone
In Pew’s survey conducted in 2023 and published on March 11, 2024, 72% also said they felt peaceful and 74% happy at least sometimes without their smartphone.
- 45%Girls on TikTok who feel addicted or use it more than intended at least weekly
A U.S. survey of 1,397 girls ages 11 to 15 conducted in late 2022 found this among TikTok users. Reported daily time among users exceeded two hours on each of TikTok, YouTube and Snapchat, and 90 minutes on Instagram.
- 40%U.S. teens online almost constantly in 2025
Pew surveyed 1,458 teens ages 13 to 17 from September 25 to October 9, 2025; 97% reported going online daily. Constant internet use fell from 46% in 2024, but this broad internet question does not measure addiction or time on social media alone.
- 36%U.S. teens using at least one of five platforms almost constantly, 2025
Pew measured YouTube, TikTok, Instagram, Snapchat and Facebook. This combined figure counts teens who used any of the platforms almost constantly; adding the separate platform percentages would count some teens more than once.
| Platform | Teens who use it | Teens who use it almost constantly | Source |
|---|---|---|---|
| YouTube | 92% | 17% of all teens | Pew, 2025 topline |
| TikTok | 68% | 21% of all teens | Pew, 2025 topline |
| 63% | 12% of all teens | Pew, 2025 topline | |
| Snapchat | 55% | 12% of all teens | Pew, 2025 topline |
| 31% | 3% of all teens | Pew, 2025 topline |
Girls, boys and constant use
Pew’s 2024 survey found girls more likely than boys to use TikTok almost constantly (19% versus 13%), while boys were more likely to use YouTube that way (19% versus 11%). In Gallup’s 2023 survey of ages 13 to 19, girls reported 5.3 daily social media hours and boys 4.4. CDC’s high school survey found frequent use among 81.8% of female students and 72.9% of male students. In Pew’s separate 2024 survey of perceived effects, 25% of girls and 14% of boys said social media hurt their mental health; 50% and 40% said it hurt sleep. Sources: Pew, 2024; Gallup, 2023; CDC, 2024; Pew, 2025.
The phone addiction test and internet addiction test on Psychology.com offer a starting point for reflecting on your habits. A screening result should be interpreted alongside the effect of use on daily life.
The platform table uses all teens as its denominator, including teens who do not use a particular service. It answers how widespread each pattern is across the teen population. A percentage calculated only among users would answer a different question and would be higher; neither denominator turns frequent use into an addiction diagnosis.
Adults and daily use
In Pew’s 2025 survey, nine in ten U.S. adults owned a smartphone and four in ten described being online almost constantly. A separate consumer survey asked adults about phone pickups and feelings about their devices. Those self-reported habits describe everyday engagement, while clinical impairment requires a different kind of assessment.
U.S. adults who say they are online almost constantly
Pew's 2025 survey of 5,022 adults found nine in ten online daily and 41% almost constantly, a figure that has held steady since 2023. The age gradient is steep: 63% of 18 to 29 year olds against 14% of adults 65 and older.
- 186Daily phone checks reported by respondents to a U.S. consumer survey
Reviews.org reported 186 daily checks in its 2026 edition versus 205 in its 2025 edition. The newer estimate comes from about 1,000 adults surveyed online in late 2025; it is self-report rather than device logging.
- 84.6%Consumer-survey respondents who check their phone within 10 minutes of waking
The same late-2025 Reviews.org survey found 76.3% felt uneasy leaving their phone at home. These reported feelings do not establish an addiction diagnosis.
- 91%U.S. adults who own a smartphone
Up from 35% in 2011. Ownership is 97% under age 30 and 78% at 65 and older.
- 52%Adults who use Facebook every day
Pew’s February 24, 2025 to March 2, 2025 survey found 48% of adults used YouTube daily and 24% used TikTok daily. A separate survey from February 5, 2025 to June 18, 2025 measured overall reach: YouTube 84%, Facebook 71%, Instagram 50% and TikTok 37%.
- 80%Adults 18 to 29 who use Instagram
The youngest adults stand out on Instagram, Snapchat, TikTok and Reddit. TikTok use among all adults has risen from 21% in 2021 to 37%.
- 2h 21mAverage daily social media time among internet users in GWI’s international survey
DataReportal’s Digital 2025 report gives 2 hours 21 minutes for social media and 6 hours 38 minutes for total internet use. These survey averages are separate from Kepios’s estimate of 5.24 billion social media user identities, equivalent to 63.9% of the world population. User identities are not necessarily unique people.
Problematic versus heavy
Hours and impairment answer different questions. A representative U.S. online study estimated functionally impairing problematic smartphone use in 0.75% to 1.2% of adults. Its authors contrasted that definition with less stringent research reporting 20% to 30%. Separately, 45.8% of respondents in a consumer survey described themselves as addicted. These figures cannot establish a clinical floor and ceiling: the samples, questions and definitions differ. Sources: Rochat et al., 2025; Reviews.org, 2026.
Social media and mental health
Research links some patterns of social media and screen use with mental health symptoms. The studies below include cross-sectional surveys, longitudinal cohorts and a historical natural experiment. Their measures and comparison groups differ. Associations in a cohort cannot by themselves establish that social media caused an individual’s symptoms or suicidal behavior.
Teens with at least four hours of weekday screen time outside schoolwork who report anxiety symptoms
CDC data for U.S. teens ages 12 to 17, collected from July 2021 through December 2023, show anxiety symptoms in the past two weeks among 27.1% of those reporting at least four hours of screen time on a typical weekday, versus 12.3% below four hours. Depression symptoms were reported by 25.9% and 9.5%, respectively. Screen time excluded schoolwork and was self-reported; the comparison is observational.
- RR 2.14Risk ratio for suicidal behaviors among children with rising addictive social media use
In the ABCD analytic cohort of 4,285 U.S. children, the increasing social media trajectory had an adjusted risk ratio of 2.14 (95% CI, 1.61 to 2.85), and the high-peaking trajectory 2.39 (1.66 to 3.43), versus the low trajectory. Data covered 2016 to 2022; addictive-use scores were child-reported at years 2 to 4. Baseline screen time was not associated with the studied outcomes.
- aPR 1.35Adjusted prevalence ratio for persistent sadness or hopelessness among frequent social media users
In the 2023 U.S. high school survey, use at least several times daily was associated with past-year sadness or hopelessness, electronic bullying (aPR 1.54) and seriously considering a suicide attempt (aPR 1.21), versus less frequent use. Models adjusted for demographic factors; these are cross-sectional associations.
- RRR 1.60 / 1.78Adjusted relative risk ratios for internalizing problems alone, versus no social media use
The 2013 to 2016 U.S. cohort included 6,595 adolescents ages 12 to 15 at baseline. Self-reported use above 3 through 6 hours daily had RRR 1.60; above 6 hours had RRR 1.78. These multinomial-model estimates compare internalizing problems alone with no problems. They are not a doubling of depression risk or a direct comparison with moderate users.
- 7% / 20%Estimated relative increases in reported severe depression and generalized anxiety after college Facebook access
The authors’ 2023 CEPR chapter summarizes their 2022 American Economic Review natural experiment, using U.S. college surveys from 2000 to 2008. The increases were relative percentages. Reported academic impairment from specified mental health conditions rose 3 percentage points from a 13% baseline. These historical rollout estimates do not measure present-day platform effects.
Braghieri, Levy and Makarin, 2023 CEPR summary of 2022 paper
- 0.64Between-person association of one extra daily social media hour with depressive-symptom score
Among 3,826 adolescents in Greater Montreal followed over four school years, with data collected from 2012 to 2018, the reported between-person coefficient was 0.64 points. Within-person associations were 0.41 points for social media and 0.18 for television in the same year. The study measured associations with symptom-scale scores; participants were not randomly assigned to screen-use levels.
- 46%Adolescents 13 to 17 who say social media makes them feel worse about their body
Only 14% say it makes them feel better, per the Surgeon General's 2023 advisory, which also reports 64% often or sometimes see hate-based content and nearly 6 in 10 girls have had uncomfortable contact from strangers.
Who reports harm, in their own words
In Pew’s survey conducted in 2024 and published in 2025, 48% of teens said social media had a mostly negative effect on people their age, while 14% said that about themselves, compared with 32% and 9% in 2022. Teens reported that social media hurt sleep (45%), productivity (40%) and grades (22%). More said it helped friendships (30%) than hurt them (7%). A separate late-2022 survey found that, among girls ages 11 to 15 with moderate to severe depressive symptoms who used each platform, 69% encountered problematic suicide-related content on TikTok and 75% on Instagram at least monthly. These reports describe participants’ experiences and cannot establish that the platforms caused symptoms. Sources: Pew, 2025; Common Sense Media, 2023.
Phone and screen time by age
Screen and phone studies cover children, adolescents and adults, but their measures differ. Some record entertainment media, some ask about social media, and others log one device. The age comparisons below belong within each study. Combining them cannot establish one continuous age curve or a universal point when use peaks.
U.S. teens ages 12 to 17 reporting at least four weekday screen hours outside schoolwork
CDC’s July 2021 to December 2023 survey found this pattern in 50.4% of teens. The estimate was 45.6% at ages 12 to 14 and 55.0% at ages 15 to 17. Girls reported 52.5% and boys 48.3%, but that difference was not statistically significant. Respondents reported time on a typical weekday, excluding schoolwork; the result is not a measure of social media alone.
- 2.5 hoursDaily screen time for children 0 to 8
Common Sense Media's 2025 census: 40% of children have their own tablet by age 2, 58% by age 4, and one in four have a cellphone by age 8. Gaming time is up 65% since 2020.
- 5:33 / 8:39Daily entertainment screen media for tweens ages 8 to 12 and teens ages 13 to 18 in 2021
Common Sense Media excluded school and homework. Both groups’ reported media time rose 17% between 2019 and 2021. In 2021, 38% of tweens had ever used social media and 88% of teens owned a smartphone. The report was published in 2022.
- 3.5 hoursAverage daily social media time for 8th and 10th graders as of 2021
Cited in the Surgeon General's advisory, which also reports that up to 95% of 13 to 17 year olds use social media and nearly 40% of 8 to 12 year olds do.
- 4.1 to 5.8 hoursDaily social media time at age 13 versus age 17
Gallup's 2023 estimate rises by more than an hour and a half across the teen years.
- 4h 06mDaily phone time for Gen Z adults, against 2h 08m for baby boomers
Reviews.org’s 2026 article attributes these screen-time figures to a separate U.S. national survey conducted in 2025. Millennials reported 3 hours 57 minutes and Gen X 3 hours 5 minutes. These figures describe phone time, which can include activities beyond social media.
- 63% to 14%Adults online almost constantly, ages 18 to 29 versus 65 and older
Pew’s 2025 survey found an age difference in self-reported constant connectivity. Smartphone ownership was 97% among adults under 30 and 78% at 65 and older. The article was published on January 8, 2026.
- 43% versus 34%Older versus younger U.S. teens online almost constantly, 2025
Pew reported 43% for ages 15 to 17 and 34% for ages 13 to 14 in the same survey. Keeping the age groups within one questionnaire makes the comparison more interpretable than comparing their percentages with an unrelated adult phone-use survey.
| Age group | Measure | Figure | Source |
|---|---|---|---|
| 0 to 8 | Daily screen time (report published 2025) | About 2.5 hours | Common Sense Media |
| 8 to 12 | Daily entertainment screen media (2021) | 5 hours 33 minutes | Common Sense Media |
| 11 to 17 | Median daily smartphone use, logged in 2022 | About 4.5 hours | Common Sense Media |
| 13 to 19 | Reported social media across seven apps (2023) | 4.8 hours | Gallup |
| 13 to 18 | Daily entertainment screen media (2021) | 8 hours 39 minutes | Common Sense Media |
| Gen Z adults | Reported daily phone time (2025 survey) | 4 hours 6 minutes | Reviews.org |
| Baby boomers | Reported daily phone time (2025 survey) | 2 hours 8 minutes | Reviews.org |
Logged phone use and age of first device
Common Sense Media’s 2023 report tracked 203 U.S. Android owners ages 11 to 17 recruited from August through November 2022. Median daily phone use was almost four and a half hours, with 51 pickups (range 2 to 498) and 237 notifications. About a quarter of notifications arrived during school hours and 5% at night. Among the 193 participants included in the school-hours analysis, 97% used their phones then; median use among those users was 43 minutes. These results describe a small Android-only sample. A separate Sapien Labs rapid report surveyed 27,969 adults ages 18 to 24 globally in early 2023. Among women reporting their first smartphone or tablet at age 6, 74% scored as distressed or struggling, versus 46% at age 18; the corresponding figures for men were 42% and 36%. This retrospective observational report cannot isolate a causal effect of device timing. Sources: Common Sense Media, 2023; Sapien Labs, 2023.
Trends 2019 to 2026
The trends differ by measure and period. Teen constant internet use was higher in 2024 than a decade earlier, but matched the 2022 share. WHO reported a rise in problematic social media use from 2018 to 2022. Adult TikTok use and support for school phone restrictions also increased over their respective survey periods. Pew’s 2025 survey subsequently found lower overall constant internet use, even as constant TikTok use increased, illustrating that platform-specific patterns and total internet frequency can move differently.
Teens online almost constantly, 2014 to 2015 versus 2024
Pew reported 24% of U.S. teens ages 13 to 17 online almost constantly in 2014 to 2015, followed by 46% in both 2022 and 2024. This is close to a doubling over the decade, with no increase between those last two observations. Teen Facebook use fell from 71% in 2014 to 2015 to 32% in 2024. Platform participation and overall time online measure different aspects of use.
- 7% to 11%Adolescents with problematic social media use, 2018 to 2022
WHO’s 2022 HBSC survey covered almost 280,000 adolescents ages 11, 13 and 15 across 44 countries and regions in Europe, central Asia and Canada. Girls reported 13% in 2022.
- 21% to 37%U.S. adults on TikTok, 2021 to 2025
Instagram went from 40% to 50%, WhatsApp from 23% to 32% and Reddit from 18% to 26% over the same four years, while YouTube and Facebook held roughly steady.
- 36% to 45%Teens who say they spend too much time on social media, 2022 to 2024
The share saying social media harms people their age went from 32% to 48% in the same window, and the share saying it harms them personally from 9% to 14%.
- 17%Growth in tween and teen media use, 2019 to 2021
Faster in two pandemic years than in the four years before, per Common Sense Media; teens' social media time rose from 1:10 to 1:27 a day.
- 35% to 91%U.S. adults with a smartphone, 2011 to 2025
The device that made constant access possible went from a minority to near-universal in 14 years.
- 205 to 186Daily phone checks in the 2025 and 2026 Reviews.org surveys
The difference is a rounded 9% decline in reported pickups. Separate consumer surveys cannot establish that individuals reduced their checks by that amount.
| Measure | Earlier | Later observation | Source |
|---|---|---|---|
| Teens online almost constantly | 24% (2014 to 2015) | 40% (2025) | Pew, 2025 topline |
| Adolescent problematic use, Europe, central Asia and Canada | 7% (2018) | 11% (2022) | WHO Europe |
| Adults on TikTok | 21% (2021) | 37% (2025) | Pew |
| Teens saying social media harms people their age | 32% (2022) | 48% (2024) | Pew |
| Adults supporting in-class school phone bans | 68% (2024) | 77% (2026) | Pew |
| Adults supporting all-day school phone bans | 36% (2024) | 48% (2026) | Pew |
| States restricting student phones | 22 states adopted restrictions by August 8, 2025 | At least 39 plus D.C. (July 28, 2026) | Ballotpedia · Education Week |
Interpreting changes across studies
The Meng review found rising digital-addiction estimates over two decades and higher estimates during the COVID-19 period. Its search ended on October 31, 2021, so it cannot establish what happened afterward. Recent survey comparisons should also retain their original definitions and populations. A stable internet-use percentage, a change in reported pickups and a change in self-described addiction are separate findings; they do not form one interchangeable trend. Source: Meng et al., 2022.
Limits, bans and interventions
School phone restrictions and Australia’s social media minimum age show how policy has changed. Policy counts and public support measure adoption and attitudes. Randomized trials of personal social media reduction address a separate question and suggest small average improvements in depressive symptoms. They do not establish that school bans improve mental health.
States, plus D.C., that require school districts to ban or restrict student phones
Education Week’s tally, updated July 28, 2026, identified at least 39 states and D.C. requiring school phone restrictions. Ballotpedia separately counted 22 states adopting restrictions during 2025 by August 8, 2025, including executive action. Pew found 77% adult support for in-class bans in middle and high schools in 2026, versus 68% in 2024; all-day support rose from 36% to 48%. These figures describe policy adoption and public opinion.
Education Week, July 28, 2026 · Pew Research Center, July 29, 2026 · Ballotpedia, August 8, 2025
- 77%Public schools that prohibit phone use during class
NCES's December 2024 School Pulse Panel of 1,490 schools: 86% of elementary and 55% of high schools. 30% ban phones in class and outside it.
- 72%School leaders who say phones hurt students' mental health
73% say phones hurt attention span and 53% academic performance, in the same federal survey.
- 41% / 17%Teens who support in-class / all-day school phone bans
Pew surveyed 1,458 U.S. teens in fall 2025; 73% opposed all-day bans in middle and high schools. In the accompanying summer-2025 adult survey, 44% supported all-day bans. The separate 48% adult figure elsewhere on this page comes from 2026.
- g = 0.28Pooled effect of reducing social media use on depressive symptoms
Ten randomized trials with 1,491 participants (mean age 24.2) yielded Hedges’ g = 0.28 (95% CI, 0.13 to 0.43). Limited-use studies estimated g = 0.33 and abstinence studies g = 0.15. The difference between those subgroups was not significant (p = 0.36), so the analysis does not establish that limits work better.
- -2.2 / -1.7Adjusted between-group differences in depression and anxiety scores after a one-week break
The 154-person randomized trial (mean age 29.6) compared a requested break from Facebook, Instagram, Twitter and TikTok with usual use. At one week, adjusted group differences favored the break: 2.2 points lower depression, 1.7 lower anxiety and 4.9 higher well-being. These scale-point differences compare the groups at follow-up after adjustment for baseline and demographic factors.
Lambert et al., Cyberpsychology, Behavior, and Social Networking, 2022
- More than 4.7MUnder-16 accounts deactivated, removed or restricted within days of Australia's minimum-age law
Australia’s law took effect on December 10, 2025. The Prime Minister released eSafety’s preliminary platform-reported account count on January 16, 2026. Accounts can outnumber individual children. This count measures implementation and does not assess mental health outcomes.
What families report
In Gallup’s 2023 survey of 1,591 U.S. teens ages 13 to 19, 41% of those reporting at least five social media hours daily rated their mental health poor or very poor, versus 23% below two hours. Stronger caregiver relationships were associated with less social media time and a weaker association between heavy use and poor mental health. These comparisons do not identify a causal effect of parenting or phone use. In a separate 2023 Pew survey, half of parents said they had looked through their teen’s phone. Parents and teens each reported phone-time arguments at least sometimes at 38%, and 46% of teens reported a parent being distracted by their phone during conversation. In Pew’s 2024 survey, 44% of teens said they had cut back on social media. Sources: Gallup, 2023; Gallup on daily use, 2023; Pew, March 11, 2024; Pew, April 22, 2025.
A habit-building worksheet can help you record your own use. If use is interfering with daily life, a licensed therapist can help explore the concerns behind it. The if-then planning worksheet offers space to compare online activities with other commitments and priorities. These personal records can make habits more concrete, while population averages remain background information rather than individual thresholds.
Common questions
Is social media addiction a real diagnosis?
Social media addiction is not a separately named diagnosis in the DSM-5-TR or ICD-11. Researchers study problematic use through symptoms such as loss of control and interference with daily life. A meta-analysis found estimates from 5% under strict classifications to 25% under more inclusive classifications. A representative U.S. smartphone study requiring functional impairment found 0.75% to 1.2%. These figures concern different measures and populations. A high screen-time total alone does not establish a disorder, and a low population estimate does not rule out serious difficulties for an individual.
How many hours a day on social media is too much?
The studies on this page do not establish a universal hourly cutoff for addiction. A U.S. adolescent cohort found adjusted relative risk ratios of 1.60 for internalizing problems alone at over 3 through 6 daily social media hours and 1.78 above 6 hours, both compared with nonuse. CDC found higher anxiety and depression symptom prevalence among teens reporting four or more weekday screen hours outside schoolwork. Both results are observational. Hours provide context alongside loss of control and interference with daily life; they cannot diagnose a person’s difficulties.
Does social media cause depression, or do depressed people use it more?
The answer depends on the population, platform and research design. A natural experiment using U.S. college surveys from 2000 to 2008 estimated that Facebook access increased reports of severe depression by 7% and generalized anxiety by 20%, relative to their baselines. That historical result does not identify the effect of every current platform. A meta-analysis of 10 randomized trials found a small average improvement in depressive symptoms after reducing use (g = 0.28). Cohort and cross-sectional associations alone cannot determine whether use causes symptoms, symptoms change use, or other factors influence both.
Which age group is most affected?
Age differences depend on the measure. Pew’s 2025 teen survey found 43% of 15 to 17 year olds online almost constantly, compared with 34% of 13 to 14 year olds. CDC’s 2021 to 2023 survey found at least four weekday screen hours outside schoolwork in 55.0% of 15 to 17 year olds and 45.6% of 12 to 14 year olds. Both concern frequency or duration; neither identifies an age group with the highest addiction prevalence. Pew; CDC.
Do school phone bans work?
The policy and attitude figures here do not establish whether school phone bans improve learning or mental health. Education Week counted at least 39 states and D.C. requiring restrictions as of July 28, 2026. NCES found 77% of public schools prohibited phones in class in December 2024. In a separate 2025 survey, 41% of teens supported in-class bans and 17% supported all-day bans. Trials of personal social media reduction address a different intervention: their small average symptom improvements cannot be assumed to show the effects of school rules.
When does heavy use become something to get help for?
Research on problematic use focuses on loss of control and interference with sleep, school, work or relationships. In Pew’s 2024 survey, 45% of teens said they spent too much time on social media; that answer alone does not establish clinical impairment. The ABCD study linked increasing addictive-use trajectories with suicidal behaviors, but it cannot show that social media caused them or predict an individual’s outcome. A licensed therapist can help explore concerns about use and mental health. If you are experiencing thoughts of self-harm, call or text 988, the U.S. Suicide and Crisis Lifeline, any time.
How we compiled this
Sources were checked on September 13, 2026 using publisher pages, report PDFs and NCBI records. Survey fieldwork years are distinguished from publication years. The page separates self-reported hours, logged device activity, screening definitions and functional impairment; these measures cannot be combined into one addiction prevalence. Risk ratios, adjusted prevalence ratios, multinomial relative risk ratios and symptom-score differences retain their distinct meanings. Observational findings are described as associations. Consumer surveys and industry reports are identified, and internally conflicting consumer figures were removed. Historical comparisons also require care: Pew changed adult survey modes during the smartphone-ownership series. Research updates are planned quarterly; this review does not establish that every displayed vintage is the newest available estimate. The September 16, 2026 update fetched Pew’s December 9, 2025 teen report and its original topline PDF, Pew’s January 8, 2026 adult internet-use article, WHO Europe’s September 25, 2024 HBSC release, Common Sense Media’s 2025 early-childhood census page, the CDC screen-time brief through the archive route and Reviews.org’s 2026 survey page. Pew’s teen update covers 1,458 respondents ages 13 to 17 surveyed from September 25 to October 9, 2025, weighted to teens living with their parents. Platform frequency percentages use all teens, rather than only users of each platform. The newer teen results supplement the dated historical figure blocks and replace the platform table’s older observation; these repeated surveys do not follow changes in each individual teen. Last full review: September 16, 2026.
Journalists and researchers may reuse any statistic with attribution to the original source and a link to Psychology.com.
Cite this source
Fontane Pennock, S. (2026, September 13). Social Media Addiction Statistics 2026. Psychology.com. https://psychology.com/social-media-addiction-statistics/
References
- Pew Research Center. (December 12, 2024). Teens, social media and technology 2024. pewresearch.org
- Pew Research Center. (April 22, 2025). Teens, social media and mental health. pewresearch.org
- Pew Research Center. (March 11, 2024). How teens and parents approach screen time. pewresearch.org
- Pew Research Center. (November 20, 2025). Americans' social media use 2025. pewresearch.org
- Pew Research Center. (January 8, 2026). Internet use, smartphone ownership, digital divides in the U.S.: What we know. pewresearch.org
- Pew Research Center. (2025). Mobile fact sheet. pewresearch.org
- Pew Research Center. (August 10, 2022). Teens, social media and technology 2022. pewresearch.org
- Pew Research Center. (January 13, 2026; July 29, 2026). About 4 in 10 teens support cellphone bans in classrooms; More Americans now support than oppose all-day school cellphone bans. teens · adults
- Gallup. (October 13, 2023). Teens spend average of 4.8 hours on social media per day. news.gallup.com · Gallup. (2023). Parenting mitigates social media-linked mental health issues. news.gallup.com
- World Health Organization Regional Office for Europe. (September 25, 2024). Teens, screens and mental health (HBSC study, 44 countries and regions). who.int
- Centers for Disease Control and Prevention, National Center for Health Statistics. (2024). Screen time among teenagers: United States, July 2021 to December 2023 (Data Brief 513). cdc.gov
- Centers for Disease Control and Prevention. (October 10, 2024). Frequent social media use and experiences with bullying victimization, persistent feelings of sadness or hopelessness, and suicide risk among high school students: Youth Risk Behavior Survey, United States, 2023. MMWR Supplement 73(4). cdc.gov
- Office of the U.S. Surgeon General. (2023). Social media and youth mental health: The U.S. Surgeon General's Advisory. U.S. Department of Health and Human Services. hhs.gov (PDF)
- Xiao, Y., Meng, Y., Brown, T. T., Keyes, K. M., & Mann, J. J. (2025). Addictive screen use trajectories and suicidal behaviors, suicidal ideation, and mental health in US youths. JAMA, 334(3), 219 to 228. NCBI full text
- Riehm, K. E., et al. (2019). Associations between time spent using social media and internalizing and externalizing problems among US youth. JAMA Psychiatry. NCBI article record
- Boers, E., Afzali, M. H., Newton, N., & Conrod, P. (2019). Association of screen time and depression in adolescence. JAMA Pediatrics. NCBI article record
- Meng, S. Q., et al. (2022). Global prevalence of digital addiction in general population: A systematic review and meta-analysis. Clinical Psychology Review, 92, 102128. PubMed
- Cheng, C., Lau, Y. C., Chan, L., & Luk, J. W. (2021). Prevalence of social media addiction across 32 nations: Meta-analysis with subgroup analysis of classification schemes and cultural values. Addictive Behaviors, 117, 106845. PubMed
- Rochat, L., et al. (2025). Problematic smartphone use in a representative sample of US adults: Prevalence and predictors. Addictive Behaviors, 162, 108228. PubMed
- Braghieri, L., Levy, R., & Makarin, A. (2022). Social media and mental health. American Economic Review, 112(11). aeaweb.org · CEPR Press chapter summary (2023), chapter 2: cepr.org (PDF)
- Lambert, J., Barnstable, G., Minter, E., Cooper, J., & McEwan, D. (2022). Taking a one-week break from social media improves well-being, depression, and anxiety: A randomized controlled trial. Cyberpsychology, Behavior, and Social Networking, 25(5). researchportal.bath.ac.uk
- May, W., Malouff, J. M., & Meynadier, J. (2025). Reducing social media use decreases depression symptoms: A meta-analysis of randomised controlled trials. European Journal of Investigation in Health, Psychology and Education, 15(11), 222. NCBI full text
- Common Sense Media. (2022; 2023). The Common Sense census: Media use by tweens and teens, 2021; Constant companion: A week in the life of a young person's smartphone use. census PDF · Constant Companion PDF
- Common Sense Media. (March 30, 2023; February 26, 2025). Teens and mental health: How girls really feel about social media; The 2025 Common Sense census: Media use by kids zero to eight (press releases). girls report · 2025 census
- Sapien Labs. (2023). Age of first smartphone/tablet and mental wellbeing outcomes (Rapid Report). sapienlabs.org (PDF)
- National Center for Education Statistics. (February 19, 2025). More than half of public school leaders say cell phones hurt academic performance (School Pulse Panel). ies.ed.gov
- Education Week. (July 28, 2026). Which states ban or restrict cellphones in schools? edweek.org · Ballotpedia News. (August 8, 2025). Twenty-two states enacted K-12 cellphone bans so far in 2025. news.ballotpedia.org
- Reviews.org. (2026). Cell phone usage stats 2026: Americans check their phones 186 times a day (survey of about 1,000 U.S. adults). reviews.org
- Kemp, S. (February 3, 2025). Digital 2025: Global overview report. DataReportal / Kepios. datareportal.com
- Prime Minister of Australia. (January 16, 2026). 4.7 million accounts deactivated, removed or restricted (media release). pm.gov.au
- Pew Research Center. (December 9, 2025). Teens, social media and AI chatbots 2025. Publisher report; Original survey topline and historical comparisons.
More statistics and related pages
Talk it through with a licensed therapist
If social media or phone use is interfering with daily life, a licensed therapist can help you explore your habits and the concerns behind them. Browse therapists on Psychology.com.
This page is educational information, not a diagnosis or a substitute for professional care. If you are in crisis, call or text 988 (U.S. Suicide & Crisis Lifeline), any time.