
 By
By Reviewed by
CDC found that 13.1% of Americans age 12 and older met a recent depression symptom threshold during August 2021 to August 2023. A depression statistic can describe recent symptoms, an episode during the past year or a diagnosis received at any point in life. Each answers a different question. For people living with depression and those close to them, the most useful numbers explain both how common the experience is and how often care reaches the people who need it.
Last full review: September 16, 2026 · sourced from CDC, NIMH, SAMHSA, WHO, Gallup, the Healthy Minds Study and peer-reviewed research.
Ten numbers that define depression in 2026
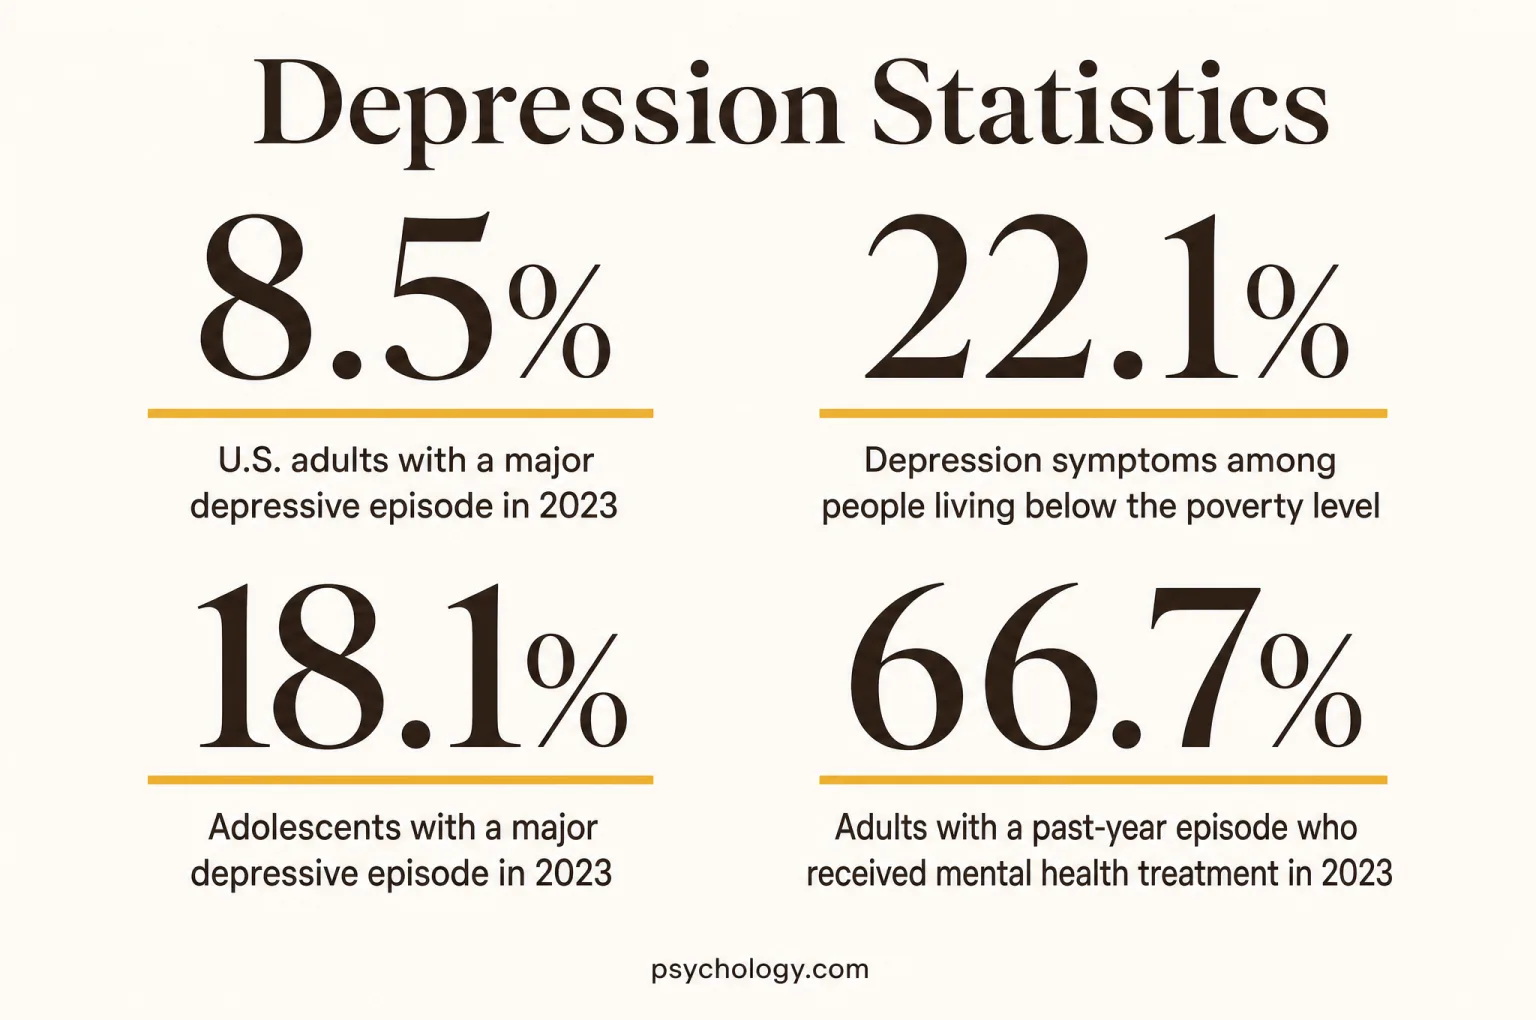
- 8.5% of U.S. adults had a major depressive episode in 2023, an estimated 21.9 million people, according to SAMHSA, 2024. SAMHSA, 2024
- 13.1% of Americans age 12 and older met a depression symptom threshold in NHANES during August 2021 to August 2023, according to CDC, 2025. CDC, 2025
- 22.1% of people age 12 and older living below the federal poverty level met that symptom threshold in August 2021 to August 2023, according to CDC, 2025. CDC, 2025
- 18.1% of U.S. adolescents ages 12 to 17 had a major depressive episode in 2023, representing 4.5 million young people, according to SAMHSA, 2024. SAMHSA, 2024
- 37% of students in the 2024 to 2025 Healthy Minds Study reported moderate to severe depressive symptoms, according to Healthy Minds Network and UCLA, 2025. Healthy Minds Network / UCLA, 2025
- 87.9% of people meeting the NHANES depression threshold reported difficulty with work, home or social activities in August 2021 to August 2023, according to CDC, 2025. CDC, 2025
- 66.7% of U.S. adults with a past-year major depressive episode received some mental health treatment in 2023, according to SAMHSA, 2024. SAMHSA, 2024
- The estimated incremental economic burden of U.S. adults with major depressive disorder reached $326.2 billion in 2018, expressed in 2020 dollars, according to Greenberg et al., 2021. Greenberg et al., 2021
- 19.1% of U.S. adults reported currently having or being treated for depression in Gallup’s first-quarter 2026 survey, according to Gallup, 2026. Gallup, 2026
- WHO’s updated estimate places global depression prevalence at 322 million people, using 2023 Global Burden of Disease data, according to WHO, 2026. WHO, 2026
How common depression is
Depression reaches millions of Americans, but prevalence changes with the question a survey asks. Recent symptoms, a past-year episode and a lifetime diagnosis cover different experiences. The clearest national estimates identify the population, reference period and assessment method alongside the percentage, so a larger number is not automatically evidence of a worsening trend.
U.S. adults with a major depressive episode in 2023
SAMHSA’s 2023 survey estimated 21.9 million adults with a major depressive episode during the previous year. The episode measure combines a sustained period of depressed mood or loss of interest with accompanying symptoms. It is a survey estimate for the civilian, noninstitutionalized population. People living in institutions and some people without stable housing fall outside that sampling frame, which matters when the figure is used to describe national need.
- 13.1%Recent depression symptoms among people age 12 and older
During August 2021 to August 2023, NHANES found this share met its PHQ-9 threshold for depression over the preceding two weeks, providing a snapshot of symptoms rather than a count of lifetime diagnoses.
- 29.0%A lifetime depression diagnosis in Gallup’s 2023 poll
Respondents reported whether a doctor or nurse had ever identified depression, so the percentage can include people whose symptoms had improved by the time of the survey.
- 21.0 millionThe adult count behind NIMH’s widely cited 8.3%
Both figures describe a past-year major depressive episode in 2021, making them a dated baseline rather than the prevalence estimate for the year in this page’s title.
- 14.5 millionAdults with an episode and severe impairment in 2021
NIMH places this group at 5.7% of all adults in 2021; the denominator is the adult population, rather than only adults who experienced a depressive episode.
- 15.3 millionAdults with an episode and severe impairment in 2023
SAMHSA estimated 5.9% of adults experienced this combination, showing that a large part of the population faced substantial disruption alongside the symptoms counted by the episode measure.
- 8.7%Recent depression symptoms in adults age 60 and older
This August 2021 to August 2023 NHANES estimate was lower than the adolescent estimate, while still documenting substantial need among older adults living outside institutions.
What the surveys mean by depression
In NHANES, depression is defined by a score of at least 10 on the nine-item Patient Health Questionnaire. That threshold identifies a level of recent symptoms; a survey score alone does not document a complete clinical assessment. NSDUH asks about a major depressive episode during the past year and does not exclude symptoms attributed to medical illness, substance use or medication. Its adult and adolescent questions also differ. Gallup’s lifetime diagnosis question depends partly on whether someone has previously reached a professional who recognized depression. Each measure therefore captures a different part of the experience, and adding the percentages would count overlapping groups. CDC measurement definitions; NIMH measurement caveats.
The distinction between a difficult period and a depressive episode has a separate explanation in Psychology.com’s depression or sadness resource. A depression screening questionnaire offers another way to understand the kind of symptom questions used in this research; it cannot establish a diagnosis.
Who is most affected: sex, age, race and income
National surveys show differences across sex, income and racial or ethnic groups. These patterns describe population averages within a particular survey. They can reflect differences in circumstances, exposure, recognition and reporting, while leaving substantial variation within every group. Income comparisons are especially important when assessing whether services reach people with fewer resources.
Depression symptoms among people living below the poverty level
In August 2021 to August 2023, this share of Americans age 12 and older with family income below the federal poverty level met the NHANES depression threshold. The comparison uses income relative to household needs, rather than a single dollar cutoff for every family. The association identifies an unequal distribution of symptoms; a cross-sectional survey cannot settle the direction of cause and effect.
- 16.0%Females with recent depression symptoms
In August 2021 to August 2023 NHANES, females age 12 and older had a higher symptom prevalence than males overall and in every age group except adults ages 20 to 39, where the difference was not statistically significant.
- 10.1%Males with recent depression symptoms
The male NHANES estimate for August 2021 to August 2023 shows that a lower population average still represents a substantial share reporting symptoms over the previous two weeks.
- 10.3%Adult females with a past-year episode in 2021
NIMH’s 2021 NSDUH summary uses an annual episode measure, which gives this older figure a different meaning from the recent-symptom estimates in NHANES.
- 6.2%Adult males with a past-year episode in 2021
This 2021 NSDUH result concerns adults only, so its difference from the female estimate should be assessed within the same survey and year.
- 7.4%Depression symptoms in the highest income category
Among people age 12 and older with income at least four times the poverty level, this was the August 2021 to August 2023 NHANES prevalence.
- 16.9%Multiracial adults with a past-year episode in 2023
SAMHSA’s estimate for non-Hispanic multiracial adults was higher than those for the other reported racial or ethnic groups, highlighting a group that broad averages can obscure.
- 27.5%West Virginia adult lifetime depression diagnosis in 2020
CDC’s 2023 state comparison placed West Virginia highest on age-standardized, self-reported lifetime diagnosis in 2020; this historical ranking describes recognized diagnoses rather than current symptoms or a 2026 state ranking.
- 12.7%Hawaii adult lifetime depression diagnosis in 2020
Hawaii had the lowest age-standardized estimate in the same CDC analysis, illustrating geographic differences that can reflect recognition and access to diagnosis as well as underlying experiences.
| Population | Prevalence | Source |
|---|---|---|
| Non-Hispanic multiracial adults | 13.9% | NIMH, 2021 |
| Non-Hispanic White adults | 8.9% | NIMH, 2021 |
| Non-Hispanic Black adults | 6.7% | NIMH, 2021 |
| Non-Hispanic Asian adults | 4.8% | NIMH, 2021 |
| Hispanic adults, any race | 7.9% | NIMH, 2021 |
Reading demographic differences
The historical racial and ethnic table preserves NIMH’s 2021 categories and is not a ranking of innate susceptibility. The source warns that some subgroup estimates have limited precision and that survey nonresponse can introduce bias. Sex was recorded using male and female categories only, so these results do not describe depression across the full range of gender identities. Income and race also overlap with age, health and other circumstances; separate unadjusted percentages cannot isolate the contribution of each factor. NIMH survey limitations.
Depression in teens and young adults
Adolescence and young adulthood carry a substantial burden of depressive symptoms and episodes. School surveys, college studies and household interviews reach different groups, with different questions and age ranges. The findings describe needs across education and family life, while leaving room for improvement and recovery in each young person’s experience.
Adolescents with a major depressive episode in 2023
SAMHSA estimated 4.5 million adolescents ages 12 to 17 experienced a major depressive episode during the past year. Its youth questions assess experiences in language adapted for adolescents. School, family relationships and social life also enter the assessment of impairment. This figure concerns an episode at some point during the year; it does not mean every young person was experiencing equally severe symptoms on the interview date.
- 5.0 millionThe adolescent count in NIMH’s 2021 summary
The corresponding 2021 prevalence was 20.1% among ages 12 to 17, a historical figure that remains widely quoted even though a later federal report is available.
- 29.2%Adolescent females with a past-year episode in 2021
NIMH’s estimate concerns ages 12 to 17 and an annual recall period, making it distinct from both adult estimates and school surveys about persistent sadness.
- 11.5%Adolescent males with a past-year episode in 2021
The lower male estimate in the same 2021 survey does not mean depression is rare among boys or that all affected boys had obtained a diagnosis.
- 74.7%Adolescents with an episode who had severe impairment in 2023
SAMHSA estimated 3.4 million adolescents in this group, representing 13.5% of all adolescents and showing why the denominator changes the meaning of a percentage.
- 37%College students reporting moderate to severe symptoms
The 2024 to 2025 Healthy Minds Study figure describes students at participating institutions and a symptom measure, so it does not represent all Americans of college age.
- 17.5%Young adults with a past-year episode in 2023
SAMHSA found the highest adult age-group prevalence among ages 18 to 25, a population that includes people in college, employment and other circumstances.
| Survey population | Prevalence | Source |
|---|---|---|
| Adolescents ages 12 to 13 | 13.0% | NIMH, 2021 |
| Adolescents ages 16 to 17 | 26.8% | NIMH, 2021 |
| Adults ages 18 to 25 | 18.6% | NIMH, 2021 |
| Adults ages 26 to 49 | 9.3% | NIMH, 2021 |
| Adults age 50 and older | 4.5% | NIMH, 2021 |
Age groups and assessment methods
NIMH cautions against directly comparing its adolescent and adult episode estimates because the questions differ. Its 2021 report also estimated 3.7 million adolescents with an episode and severe impairment. In a separate assessment, NHANES found recent depression symptoms in 19.2% of people ages 12 to 19 during August 2021 to August 2023, including 26.5% of females and 12.2% of males. Those NHANES age bands include older teenagers who are counted as adults in NSDUH. The different windows and thresholds help explain why a classroom, a college survey and a national household survey can produce different percentages without contradicting one another. NIMH; CDC.
Depression during pregnancy and after birth involves additional circumstances that deserve separate attention. Psychology.com’s postpartum depression screening page provides related context without folding perinatal estimates into general adolescent or adult prevalence.
Impact: health, work, suicide risk and cost
Depression affects more than symptom scores. People report difficulty managing everyday activities, and economic studies count consequences for work and health care. Physical illness can add to the burden. Suicide statistics require particular care: suicide is preventable, and a national death count cannot establish how many deaths were attributable to depression.
Estimated U.S. economic burden of adults with major depressive disorder in 2018
Greenberg and colleagues estimated the incremental annual burden in 2018 using 2020 dollar values. Their model included direct costs, workplace losses and suicide-related costs, with contributions from conditions occurring alongside depression. Incremental burden means additional costs associated with the affected population. It is broader than spending on depression treatment, and the estimate is not a measurement of costs in 2026.
- 37.9%Growth in estimated burden from 2010 to 2018
The increase reported by Greenberg and colleagues reflects a historical cost model spanning those years, rather than a forecast of how quickly costs will grow in the future.
- 61%The workplace share of estimated 2018 burden
Workplace costs formed the largest component of the model, showing that the economic consequences extend beyond the health services used by people with depression.
- 87.9%People with symptoms reporting functional difficulty
Among people meeting the NHANES depression threshold in August 2021 to August 2023, most reported at least some difficulty with work, home or social activities.
- 9.3% to 23.0%Depression occurring alongside chronic physical disease
A World Health Surveys analysis published in 2007 found this range among participants with one or more studied chronic diseases, documenting overlapping needs rather than proving one condition caused the other.
- 245,404Participants in the historical chronic-disease analysis
The 2007 study drew on adults in 60 countries, giving the comparison international scope while leaving differences between diseases and countries within the pooled findings.
- 49,316U.S. suicide deaths in 2023 across all circumstances
NIMH reports the CDC total; it includes many different histories and cannot be labeled as deaths caused by depression, and prevention remains possible.
Difficulty with daily life is an outcome in its own right
The NHANES functioning question asks whether reported symptoms made work, home responsibilities or getting along with others more difficult. It therefore captures disruption that may remain invisible in employment or health-spending records. Some people continue going to work or school while experiencing substantial difficulty. Others may have symptoms alongside an existing physical limitation. The overall difficulty percentage does not show that everyone had the same level of impairment, needed identical support or lost a job. It also differs from NSDUH’s severe-impairment measure, which uses ratings across specific life domains. CDC definitions; NIMH impairment definitions.
Depression and physical health
NIMH links depression with other health conditions, including heart disease and diabetes. Their coexistence can complicate everyday life, but a prevalence comparison cannot disentangle shared circumstances, the effects of illness or the direction of an association. Historical research remains useful for showing that mental and physical health needs can overlap. Its percentages should not be applied as a current prognosis for a person with a specific diagnosis. NIMH depression overview.
Treatment and the care gap
Treatment access and treatment outcomes answer different questions. Surveys can count contact with services, while trials compare changes in symptoms. Receiving care does not establish its duration, adequacy or benefit. Treatment-resistant depression adds another distinction because its prevalence depends on which previous treatment attempts a study can observe.
Adults with a past-year episode who received mental health treatment in 2023
SAMHSA’s treatment category includes several forms and settings of care, including outpatient services, medication and telehealth. The denominator is adults with a major depressive episode during the past year. The percentage records whether any qualifying mental health treatment occurred, rather than establishing that everyone completed a full course for depression or improved. Comparing it with an older treatment estimate requires checking whether the service questions remained the same.
- 59.8%Adolescents with an episode receiving mental health treatment
This 2023 SAMHSA measure concerns adolescents ages 12 to 17 and includes a broad range of mental health services, rather than depression-specific therapy alone.
- 39.3%Counseling or therapy among people with recent symptoms
In August 2021 to August 2023 NHANES, this share of people meeting the depression threshold reported counseling or therapy during the previous year.
- 30.9%Treatment resistance within medication-treated MDD
A U.S. model published in 2021 estimated this proportion using historical claims and survey inputs, so the result should not be generalized to everyone with depression.
- 2.8 millionModeled adults with treatment-resistant depression
The same 2021 analysis estimated a national count over a year, making it a modeled population figure rather than a registry of individually assessed cases.
- 47.2%Treatment resistance’s share of modeled economic burden
This share refers to medication-treated major depressive disorder in the 2021 model, indicating disproportionate burden within that defined population.
- 21Antidepressants evaluated in the major 2018 review
Cipriani and colleagues found all studied drugs more efficacious than placebo for acute adult major depression across 522 trials involving 116,477 participants, with searches ending in 2016.
| Population in 2021 | Received treatment | Source |
|---|---|---|
| Adults with a past-year episode | 61.0% | NIMH |
| Adults with an episode and severe impairment | 74.8% | NIMH |
| Adolescents with a past-year episode | 40.6% | NIMH |
| Adolescents with an episode and severe impairment | 44.2% | NIMH |
| Comparison | Hedges g | Source |
|---|---|---|
| CBT versus control conditions | 0.79 | Cuijpers et al. |
| Combined treatment versus medication alone, short term | 0.51 | Cuijpers et al. |
| CBT versus controls in children and adolescents | 0.41 | Cuijpers et al. |
Interpreting treatment outcomes
Hedges g expresses an average symptom difference in standardized units; it is not a percentage who recovered. The CBT results combine studies with different populations and control conditions. The 2018 antidepressant review examined acute adult treatment and excluded several clinically important populations, limiting its reach. Neither review establishes which treatment will work for a particular person. The historical NIMH treatment table also uses different adult and adolescent questions, so it should not be read as a direct comparison of equivalent services across age groups. Cuijpers et al.; Cipriani et al.; NIMH.
Delay before first contact
Wang and colleagues’ analysis of a U.S. survey conducted in 2001 to 2003 reported initial treatment delays of 6 to 8 years across mood disorders among people who eventually made contact. This older, broader category includes more than depression and does not establish a current depression-specific waiting time. It measures the interval from onset to initial contact, which can include years before someone seeks services; an appointment waiting list measures a different interval. Wang et al., 2005.
Differences in access to counseling
Among people meeting the NHANES depression threshold in August 2021 to August 2023, 43.0% of females and 33.2% of males reported counseling or therapy during the previous year. These service-use differences can coexist with differences in symptoms, recognition and preferences. The survey does not establish which barrier explains an individual’s lack of contact with care. CDC, 2025.
Psychology.com’s behavioral activation worksheet explains how activities enter therapy discussions, while the daily diary card provides a format for describing daily experiences. These educational worksheets measure neither treatment effectiveness nor recovery. People exploring professional support can use the directory to find a licensed therapist and discuss their circumstances.
Trends 2019 to 2026
The period spanning the pandemic includes changes in reported depression and changes in how surveys collected data. A useful trend follows a consistent measure and identifies any break in the series. A publication dated 2026 can still describe earlier survey years, so the release date and the observation period both matter.
Current depression or treatment in Gallup’s first-quarter 2026 poll
Gallup’s early-2026 reading remained elevated, numerically just below the preceding quarter’s 20.0%, a level Gallup described as similar. Its question combines currently having depression with currently being treated for it. Among adults ages 18 to 29, the corresponding 2026 estimate was 28.0%.
- 20.0%Gallup’s fourth-quarter 2025 reading
The same current-depression-or-treatment measure was higher numerically than in early 2026, while a single quarter does not establish a sustained change.
- 17.4%Gallup’s second-quarter 2024 reading
This provides an earlier comparison within Gallup’s series, which should remain separate from federal estimates based on symptom or episode criteria.
- 17.8%The result in Gallup’s original 2023 report
The May 17, 2023 publication reported this current-depression-or-treatment figure; it is retained as that publication’s estimate rather than substituted into a later revised series.
- 11.4%Adults taking medication for depression in 2023
CDC’s National Health Interview Survey asked about prescription medication specifically for depression, providing a service-use measure rather than a symptom prevalence estimate.
- 15.3%Women taking medication for depression in 2023
The female NHIS estimate was higher than the male estimate, although medication use alone cannot reveal the severity of current symptoms or the benefit received.
- 7.4%Men taking medication for depression in 2023
This male NHIS estimate includes people taking medication whose symptoms may have improved, so medication prevalence should not be used as a proxy for active depression.
The Household Pulse measurement break
CDC’s Household Pulse Survey began tracking symptoms during the pandemic, using a short depression scale. On July 21, 2021, the question’s reference period changed from the previous week to the previous two weeks. That change matters when interpreting an apparent rise or fall across the boundary. Pulse also relied on online completion, with invitations sent by email and text message to sampled addresses, and on weighting procedures that differ from established household health surveys. Its fast reporting was useful for monitoring disruption, but its estimates should not be spliced into an NHANES or NSDUH trend. A full 2020 to 2025 comparison would require verified values for each period and attention to these design changes. CDC Pulse technical notes.
Global picture
Global depression estimates combine information from countries with very different survey coverage and health systems. Models help fill gaps, but their uncertainty remains important. Treatment access also varies widely, and the share receiving any care can be much larger than the share receiving care that meets a study’s minimum standard.
People worldwide with depression in WHO’s updated estimate
WHO’s September 11, 2026 fact sheet reports this count using 2023 Global Burden of Disease estimates. It covers people of all ages. The count differs from estimates in older fact sheets and GBD rounds, so comparing those publications alone cannot establish a global decline.
- 4%Global all-age prevalence in 2023
WHO’s population percentage includes children as well as adults, which changes the denominator relative to adult-only estimates.
- 5.2%Global adult prevalence in 2023
WHO’s adult estimate is higher than its all-age percentage, illustrating why age coverage belongs beside a prevalence figure.
- 4.1% and 6.2%Global adult male and female prevalence
WHO reports these respective estimates for 2023; the difference describes population patterns and does not determine individual susceptibility.
- 5.4%Global prevalence among adults age 70 and older
WHO’s 2023 estimate documents depression in later life and uses a different age threshold from the U.S. NHANES older-adult estimate.
- 332.41 millionDepressive disorder cases in a GBD 2021 analysis
Chen and colleagues’ 2025 paper reports this modeled 2021 count, which should be interpreted within that GBD round rather than joined to the newer WHO estimate.
- 16.5%Minimally adequate treatment in a historical international study
A 2017 analysis of World Mental Health surveys across 21 countries found this share of people with past-year major depressive disorder received treatment meeting minimum study standards.
| Measure and population | Estimate | Source |
|---|---|---|
| Minimally adequate MDD treatment in surveyed low- and lower-middle-income countries, 2017 study | 1 in 27 | Thornicroft et al. |
| People with mental disorders receiving no treatment in low- and middle-income countries, WHO overview | More than 75% | WHO |
| Annual global workdays lost to depression and anxiety combined, 2024 WHO fact sheet | 12 billion days | WHO |
| Annual global productivity loss from depression and anxiety combined, 2024 WHO fact sheet | US$1 trillion | WHO |
What a global treatment gap includes
The more-than-75% estimate concerns mental disorders broadly, and should not be restated as a depression-only percentage. The historical adequate-treatment study asks a narrower question about the quality and amount of care received by people with major depressive disorder. Its low-income-country result comes from participating survey countries, rather than a census of every country in that income group. Similarly, the workplace estimates combine depression and anxiety; allocating the whole amount to depression would overstate what the source establishes. These distinctions matter when budgets, staffing or service coverage are compared. WHO treatment context; Thornicroft et al.; WHO workplace estimates.
Changes within the same model
The GBD 2021 analysis reported a nearly 11% rise in global age-standardized depressive disorder prevalence from 2019 to 2021. That is a modeled change within one study round. Age standardization helps separate changing population structure from the measured disease pattern, while model uncertainty and uneven source data remain. A later publication can revise past estimates as well as add new years, so differences between releases deserve separate interpretation. Chen et al., 2025.
Common questions
How common is depression in the United States?
SAMHSA estimated that 8.5% of U.S. adults had a major depressive episode in 2023. CDC’s separate NHANES survey found that 13.1% of people age 12 and older met a recent depression symptom threshold during August 2021 to August 2023. Gallup reported 19.1% currently having or being treated for depression in early 2026. The populations, questions and recall periods differ. These figures describe different aspects of depression and should not be averaged into a single national rate. SAMHSA; CDC; Gallup.
Why are depression rates different for women and men?
In August 2021 to August 2023 NHANES data, 16.0% of females and 10.1% of males age 12 and older met the depression symptom threshold. Those survey results establish a population difference, while leaving its causes open. Biological, social and psychological factors can interact, and experiences within each group vary widely. Differences in reporting, recognition and access to care also matter when comparing symptom surveys with diagnosis records. An average for a sex category cannot establish whether a particular person has depression. CDC; NIMH.
Are teenagers and college students experiencing more depression?
Recent surveys show substantial need among both groups. In 2023, 18.1% of adolescents ages 12 to 17 had a past-year major depressive episode, according to SAMHSA. In the 2024 to 2025 Healthy Minds Study, 37% of college students reported moderate to severe symptoms. These surveys cover different populations and use different measures, so the percentages cannot establish that college attendance doubles risk. Change over time requires comparable questions, sampling and reporting periods within each survey. SAMHSA; Healthy Minds / UCLA.
Do treatment statistics show that depression treatment works?
Treatment receipt and treatment benefit are separate measures. SAMHSA’s 66.7% treatment figure for adults with a major depressive episode in 2023 records service use. Randomized trials address benefit: a 2023 meta-analysis found cognitive behavioral therapy reduced depression symptoms relative to control conditions, while a major 2018 review found all studied antidepressants more effective than placebo for acute adult depression. Average benefits do not mean everyone responds, and the trial populations and follow-up periods place limits on interpretation. SAMHSA; Cuijpers et al.; Cipriani et al..
Does treatment-resistant depression mean someone cannot recover?
Treatment-resistant depression is a research and clinical category describing inadequate benefit from previous treatment attempts. A U.S. model published in 2021 estimated it in 30.9% of adults with medication-treated major depressive disorder. That denominator excludes people whose depression was untreated or managed without medication. The result is an estimate from historical claims and survey inputs, rather than a current census or a forecast of permanent illness. A treatment history describes what has happened so far; it does not establish every future outcome. Zhdanava et al.. Esketamine nasal spray and transcranial magnetic stimulation are approved or cleared in the U.S. for adults whose depression has not responded to antidepressants. Clinics offering ketamine-based treatment are listed in Regenerated.com's ketamine therapy directory. Psychology.com and Regenerated.com share ownership, and a directory listing is not a recommendation.
How is depression related to suicide risk?
Depression is associated with suicide risk, but suicide has multiple interacting contributors and is preventable. National suicide totals include people with many different histories and cannot be treated as the number of deaths caused by depression. Population figures also cannot predict what will happen to an individual. Support is available: if you or someone you know is thinking about suicide, call or text 988 in the United States to reach the Suicide and Crisis Lifeline. WHO; NIMH.
How we compiled this
Figures were checked against source pages, federal reports and research abstracts fetched for the September 13, 2026 review. The accompanying source bank records the figure, population, year, URL and a short verbatim excerpt. Federal surveys receive priority for U.S. prevalence; WHO and published GBD analyses provide global context. Symptoms, episodes, diagnoses, treatment receipt and treatment outcomes remain distinct. Historical findings retain their dates, and cost models retain their currency years. CDC pages accessible through the web reader were used where direct downloads were blocked. Unverified estimates were excluded. Different survey designs and modeling rounds are not treated as a continuous trend, and reported associations do not establish causation. The September 16, 2026 update checked CDC, WHO and Gallup publisher pages and added CDC’s historical state comparison. Newer SAMHSA report retrieval was unsuccessful, so the existing dated NSDUH estimates remain unchanged; a search result alone was not used to replace a figure. Last full review: September 16, 2026.
Journalists and researchers may reuse any statistic with attribution to the original source and a link to Psychology.com.
Cite this source
Fontane Pennock, S. (2026, September 13). Depression Statistics 2026. Psychology.com. https://psychology.com/depression-statistics/
References
- National Institute of Mental Health. (2023). Major depression: statistics from the 2021 National Survey on Drug Use and Health. Source
- Substance Abuse and Mental Health Services Administration. (2024). Key substance use and mental health indicators in the United States: Results from the 2023 National Survey on Drug Use and Health. Source
- Brody, D. J., & Hughes, J. P. (2025). Depression prevalence in adolescents and adults: United States, August 2021 to August 2023. NCHS Data Brief, 527. Source
- Elgaddal, N., Weeks, J. D., & Mykyta, L. (2025). Characteristics of adults age 18 and older who took prescription medication for depression: United States, 2023. NCHS Data Brief, 528. Source
- Witters, D. (May 17, 2023). U.S. depression rates reach new highs. Gallup. Source
- Witters, D. (April 21, 2026). U.S. depression rate remains elevated. Gallup. Source
- World Health Organization. (September 11, 2026). Depressive disorder (depression). Fact sheet using GBD 2023 estimates. Source
- Healthy Minds Network. (September 9, 2025). The Healthy Minds Study: 2024 to 2025 data report. UCLA Center for Health Policy Research publication summary. Source
- Greenberg, P. E., et al. (2021). The economic burden of adults with major depressive disorder in the United States (2010 and 2018). PharmacoEconomics, 39, 653-665. Source
- Zhdanava, M., et al. (2021). The prevalence and national burden of treatment-resistant depression and major depressive disorder in the United States. Journal of Clinical Psychiatry, 82(2), 20m13699. Source
- Cipriani, A., et al. (2018). Comparative efficacy and acceptability of 21 antidepressant drugs for the acute treatment of adults with major depressive disorder: A systematic review and network meta-analysis. The Lancet, 391, 1357-1366. Source
- Cuijpers, P., et al. (2023). Cognitive behavior therapy vs. control conditions, other psychotherapies, pharmacotherapies and combined treatment for depression: A comprehensive meta-analysis including 409 trials with 52,702 patients. World Psychiatry, 22, 105-115. Source
- Thornicroft, G., et al. (2017). Undertreatment of people with major depressive disorder in 21 countries. British Journal of Psychiatry, 210, 119-124. Source
- Wang, P. S., et al. (2005). Failure and delay in initial treatment contact after first onset of mental disorders in the National Comorbidity Survey Replication. Archives of General Psychiatry, 62, 603-613. Source
- Moussavi, S., et al. (2007). Depression, chronic diseases, and decrements in health: Results from the World Health Surveys. The Lancet, 370, 851-858. Source
- Chen, X., et al. (2025). Trends in prevalent cases and disability-adjusted life-years of depressive disorders worldwide: Findings from the Global Burden of Disease Study from 1990 to 2021. Depression and Anxiety, 5553491. Source
- World Health Organization. (September 2, 2024). Mental health at work. Source
- World Health Organization. (n.d.). Depression: Health topic overview and barriers to care. Source
- National Institute of Mental Health. (n.d.). Suicide: Statistics based on CDC mortality data, including 2023 national totals. Source
- Centers for Disease Control and Prevention. (n.d.). Anxiety and depression: Household Pulse Survey. Measurement definitions and technical notes. Source
- National Institute of Mental Health. (n.d.). Depression: Health topic overview. Source
- Centers for Disease Control and Prevention. (June 16, 2023). National, state-level, and county-level prevalence estimates of adults self-reporting a lifetime diagnosis of depression: United States, 2020. MMWR, 72, 644-650. CDC, June 16, 2023
More statistics and related pages
Talk it through with a licensed therapist
Depression can affect relationships, work and everyday routines. Psychology.com’s therapist directory provides a place to explore professional support and find someone to talk with about your circumstances.
This page is educational information, not a diagnosis or a substitute for professional care. If you are in crisis, call or text 988 (U.S. Suicide & Crisis Lifeline), any time.