
 By
By Reviewed by
NIMH estimates that 19.1% of U.S. adults had a past-year anxiety disorder in its 2001 to 2003 diagnostic survey. For a more recent symptom measure, SAMHSA reports that 6.6% of adults had moderate or severe anxiety symptoms during the previous two weeks in 2025. These measures answer different questions: the first covers a broad historical group of disorders, while the second applies a recent symptom threshold. Comparisons need the same survey, population and definition across time.
Last full review: September 16, 2026 · sourced from NIMH, CDC, SAMHSA, WHO, national student surveys and peer-reviewed research.
Ten numbers that define anxiety in 2026
- 19.1% of U.S. adults had a past-year anxiety disorder in NIMH’s 2001 to 2003 survey, using a broad historical diagnostic category. NIMH, 2001 to 2003 data
- 31.1% of U.S. adults reported a lifetime anxiety disorder in NIMH’s 2001 to 2003 survey program. NIMH, 2001 to 2003 data
- WHO estimates 470 million people worldwide had an anxiety disorder in 2023, identifying anxiety as the most common mental disorder group. WHO, September 15, 2026 fact sheet
- 11% of U.S. children ages 3 to 17 had current diagnosed anxiety in 2023 to 2024, according to CDC’s summary of parent reports. CDC, 2026
- 17 years was the median onset age for anxiety and fear-related disorders in Solmi and colleagues’ meta-analysis published in 2022. Solmi et al., 2022
- 18.2% of U.S. adults in CDC’s National Health Interview Survey had at least mild anxiety symptoms in 2022, compared with 15.6% in 2019 on the same symptom scale. CDC/NCHS, 2024
- 32% of students in the 2024 to 2025 Healthy Minds Study reported moderate to severe anxiety. Healthy Minds Study, 2025
- 27.6% of people with an anxiety disorder received any past-year treatment in Alonso and colleagues’ historical 21-country analysis published in 2018. Alonso et al., 2018
- 25.6% was the COVID-19 Mental Disorders Collaborators’ modeled global increase in anxiety disorder prevalence attributable to the pandemic in 2020. COVID-19 Mental Disorders Collaborators, 2021
- 48% of U.S. adults in the American Psychiatric Association’s 2026 poll said they felt more anxious than the previous year. American Psychiatric Association, 2026
How common anxiety is
Anxiety is common, although its measured prevalence depends on what researchers ask and whom they include. Diagnostic interviews identify disorders over a defined period. Symptom questionnaires capture recent feelings and their frequency. U.S. adult surveys, child diagnosis reports and global models therefore provide complementary views of the burden.
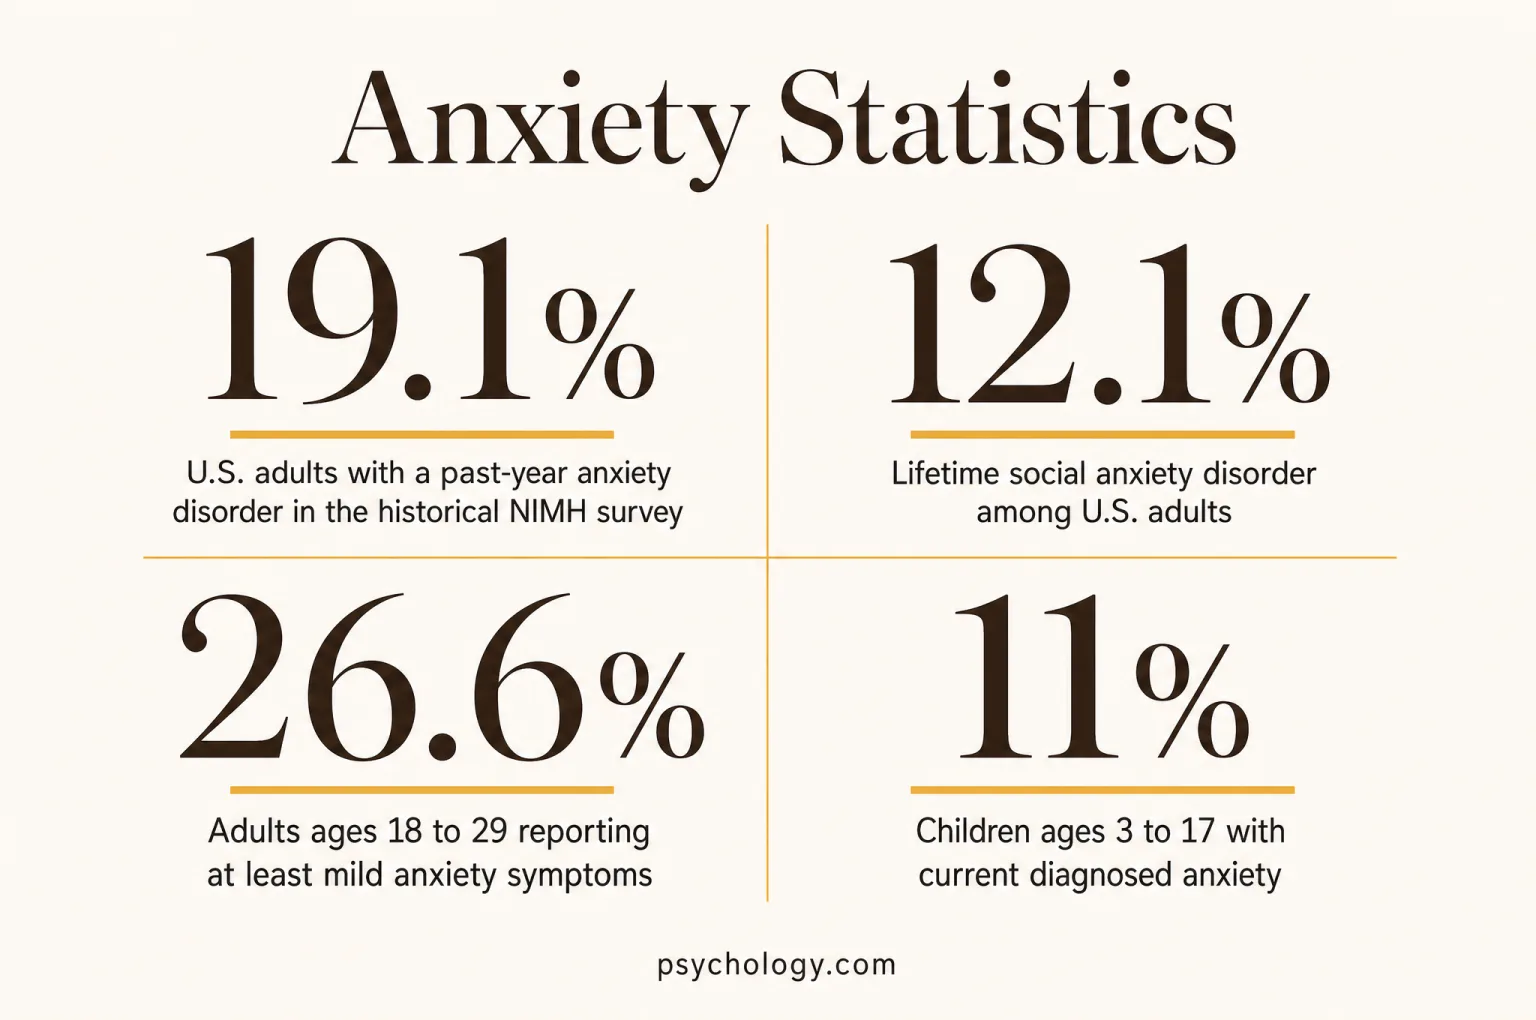
U.S. adults with a past-year anxiety disorder in the historical NIMH survey
The National Comorbidity Survey Replication interviewed adults during 2001 to 2003. Its 19.1% estimate describes disorders during the year before interview, rather than diagnoses recorded in medical charts. The category includes conditions that later moved to separate diagnostic groups, including OCD and PTSD. It remains a useful historical benchmark for the breadth of anxiety-related illness, with that definition kept visible. The survey covered adults living in households and used structured interviews, so its estimate has a different basis from a short online symptom questionnaire.
- 31.1%Lifetime anxiety disorder in U.S. adults
In the 2001 to 2003 NIMH survey program, 31.1% met criteria at some point before interview, a broader window than the previous year.
- 18.2%Recent anxiety symptoms in U.S. adults
The 2022 National Health Interview Survey found 18.2% had at least mild symptoms during the previous two weeks, using the seven-item GAD scale.
- 2.8%Severe recent anxiety symptoms
In the same 2022 NHIS sample, 2.8% were in the severe symptom category, showing how much the estimate changes when the threshold is raised.
- 470 millionPeople worldwide with anxiety disorders
WHO’s September 15, 2026 fact sheet reports 470 million people with anxiety disorders in 2023, citing GBD 2023 estimates; the global count covers all ages.
- 5.8%Global anxiety disorder prevalence
WHO’s September 15, 2026 fact sheet estimates global anxiety disorder prevalence at 5.8%, citing GBD 2023; this worldwide denominator differs from a U.S. adult sample.
- 6.6%U.S. adults with moderate or severe anxiety symptoms in 2025
SAMHSA’s 2025 NSDUH found moderate or severe anxiety symptoms during the previous two weeks in 6.6% of adults; its threshold excludes mild symptoms and does not identify every anxiety disorder.
Why similar percentages can describe different experiences
The NIMH and NHIS adult estimates happen to sit close together, but their similarity does not establish stable prevalence over time. The older study used diagnostic criteria and a year-long recall period; NHIS asked about symptoms over a fortnight and included mild symptoms. A person can report substantial symptoms without having a recorded diagnosis, and someone with a diagnosed disorder can have relatively few symptoms during a particular survey window. Access to assessment also affects the number of diagnosed cases. Those differences matter whenever figures are used to plan services or describe unmet need.
Psychology.com’s explanation of normal anxiety and anxiety disorders gives context for the terms used in these surveys.
Types of anxiety disorders
Anxiety disorders share fear and worry, but the situations involved can be very different. Specific phobias concern particular objects or situations; social anxiety centers on scrutiny or judgment; panic disorder involves recurrent unexpected attacks. Generalized anxiety extends across everyday concerns. Each condition has its own prevalence and pattern of impairment.
Lifetime social anxiety disorder among U.S. adults
NIMH reports a 12.1% lifetime prevalence of social anxiety disorder in its 2001 to 2003 survey program. The older term social phobia refers to the same condition in these statistics. The estimate concerns a persistent pattern of fear in social or performance situations that met the study’s diagnostic criteria. It is broader than a current diagnosis count and narrower than the number of people who sometimes feel shy or uncomfortable speaking in public. Lifetime reporting also depends on remembering earlier experiences, including episodes that have resolved.
- 9.1%Past-year specific phobia
Specific phobia affected 9.1% of U.S. adults in 2001 to 2003, making it the most prevalent individual anxiety disorder among the NIMH categories compared here.
- 7.1%Past-year social anxiety disorder
The corresponding 2001 to 2003 estimate was 7.1%, reflecting fear of social scrutiny that extends beyond ordinary discomfort.
- 2.7%Past-year generalized anxiety disorder
GAD affected 2.7% in the 2001 to 2003 survey, with excessive worry across activities or events rather than a single feared object.
- 2.7%Past-year panic disorder
Panic disorder also affected 2.7% in 2001 to 2003; equal prevalence does not imply that its symptoms or effects resemble GAD.
- 0.9%Past-year agoraphobia
NIMH reports 0.9% in 2001 to 2003, describing fear or avoidance of situations where escape might feel difficult.
| Condition | Lifetime prevalence | Source |
|---|---|---|
| Specific phobia | 12.5% | NIMH, Specific Phobia |
| Generalized anxiety disorder | 5.7% | NIMH, Generalized Anxiety Disorder |
| Panic disorder | 4.7% | NIMH, Panic Disorder |
| Agoraphobia | 1.3% | NIMH, Agoraphobia |
A panic attack and panic disorder have different denominators
A cross-national World Mental Health analysis published in 2016 estimated lifetime panic attacks at 13.2%. Among people who had ever experienced an attack without meeting criteria for panic disorder, about two thirds (66.5%) reported recurrent attacks. These figures describe attacks across the participating populations, most of whom did not meet criteria for panic disorder. The study examined interviews with 142,949 adults in 25 countries, fielded over several years, so its results provide historical cross-national context rather than a current U.S. rate. Repetition, unexpectedness and the ongoing consequences of attacks matter to the distinction between an experience and a disorder. de Jonge et al., Depression and Anxiety
The social anxiety screening and panic disorder screening pages describe different symptom patterns. Their screening results have a different purpose from the diagnostic interviews behind these estimates. Because one person can meet criteria for several disorders, the percentages in this section overlap and should never be added to produce an overall anxiety rate.
Who is most affected: sex, age and life stage
Women and younger adults report more anxiety in several U.S. surveys, while financial circumstances also matter. These patterns describe groups and leave considerable variation within them. Student surveys add useful detail about college life, although participating campuses and respondents do not represent every young adult in the country.
Adults ages 18 to 29 reporting at least mild anxiety symptoms
In the 2022 NHIS, 26.6% of adults ages 18 to 29 reported at least mild anxiety symptoms during the previous two weeks. This was the highest prevalence among the age groups in that analysis. The finding describes recent symptom burden across young adults, including those outside higher education. Differences between age groups can reflect life circumstances, generational experiences, symptom reporting and other influences. The cross-sectional survey cannot separate those explanations or show that an individual’s symptoms will necessarily diminish as they get older.
- 21.4%Women with recent anxiety symptoms
In 2022, 21.4% of women had at least mild symptoms in NHIS, using the same fortnight-long recall period as the overall adult estimate.
- 14.8%Men with recent anxiety symptoms
The corresponding 2022 figure for men was 14.8%, showing a sex difference without implying that anxiety is unusual among men.
- 28.4%Adults below the federal poverty level
At least mild anxiety symptoms affected 28.4% of this income group in 2022, an association that does not establish a single direction of causation.
- 13.4%Adults at or above four times the poverty level
The equivalent 2022 symptom estimate was 13.4%, placing the income gradient within a common survey and measurement system.
- 32%College students with moderate to severe anxiety
The 2024 to 2025 Healthy Minds Study reported 32% at a moderate to severe threshold, among students at participating campuses rather than a national sample of young adults.
- 36.9%Graduate and professional students reporting an anxiety diagnosis
In ACHA’s spring 2025 graduate and professional reference group, drawn from 81 U.S. institutions, 36.9% of valid respondents reported ever being diagnosed with anxiety by a healthcare or mental health professional; this is a history-of-diagnosis measure.
ACHA-NCHA IIIb, Graduate/Professional Reference Group, item 65A7
| Age group | Prevalence | Source |
|---|---|---|
| 18 to 29 | 22.3% | NIMH, Any Anxiety Disorder |
| 30 to 44 | 22.7% | NIMH, Any Anxiety Disorder |
| 45 to 59 | 20.6% | NIMH, Any Anxiety Disorder |
| 60 and older | 9.0% | NIMH, Any Anxiety Disorder |
Sex differences depend on the anxiety measure
NIMH’s 2001 to 2003 figures for any past-year anxiety disorder were 23.4% among women and 14.3% among men. For GAD specifically, they were 3.4% and 1.9%. Both comparisons show higher prevalence among women, but neither establishes a universal two-to-one ratio for anxiety. The categories reported by these historical studies also provide limited information about gender diversity. College diagnosis figures are especially sensitive to access to assessment, so a higher reported diagnosis rate can reflect both greater distress and more contact with services. NIMH, Any Anxiety Disorder; NIMH, Generalized Anxiety Disorder
Anxiety in children and teens
Child anxiety can be measured through parent-reported diagnoses, interviews with teenagers or direct symptom questionnaires. Recent CDC estimates capture current diagnosed conditions and recent symptoms. NIMH’s older adolescent interviews provide lifetime detail by disorder. Keeping these sources separate helps explain why a childhood estimate can look much smaller than an adolescent one.
Children ages 3 to 17 with current diagnosed anxiety
CDC’s current summary reports that 11% of children ages 3 to 17 had diagnosed anxiety that was still current in 2023 to 2024. The National Survey of Children’s Health asks parents or caregivers about a professional diagnosis and whether the condition remains present. That approach can miss children whose difficulties have not been recognized or assessed. It also differs from asking a teenager directly about recent feelings. The age range spans preschool through late adolescence, when social expectations, school experiences and recognition of emotional difficulties can be very different.
- 10%Boys with current diagnosed anxiety
CDC reports 10% among boys ages 3 to 17 in 2023 to 2024, based on parent or caregiver reports.
- 13%Girls with current diagnosed anxiety
The corresponding estimate for girls was 13% in 2023 to 2024, showing that the sex difference is already visible before adulthood.
- 20%Teenagers reporting recent anxiety symptoms
Among ages 12 to 17 in the 2021 to 2023 NHIS-Teen data, 20% reported anxiety symptoms during the previous two weeks.
- 31.9%Lifetime anxiety disorder in adolescent interviews
NIMH’s 2001 to 2004 survey found 31.9% among ages 13 to 18, using a broader historical diagnostic framework and a lifetime window.
- 19.3%Lifetime specific phobia among adolescents
The 2001 to 2004 estimate was 19.3%, illustrating how a particular fear-related disorder contributes to the broader adolescent anxiety picture.
- 9.1%Lifetime social anxiety among adolescents
Social anxiety affected 9.1% in the 2001 to 2004 adolescent interviews, when fear of scrutiny could concern school, friendships or performance.
- 18.0%Adolescents with moderate or severe anxiety symptoms in 2025
SAMHSA’s 2025 NSDUH found moderate or severe anxiety symptoms in the previous two weeks among 18.0% of adolescents ages 12 to 17; this direct symptom measure differs from parent-reported diagnoses.
| Population or disorder | Prevalence | Source |
|---|---|---|
| Generalized anxiety disorder | 2.2% | NIMH, Generalized Anxiety Disorder |
| Panic disorder | 2.3% | NIMH, Panic Disorder |
| Agoraphobia | 2.4% | NIMH, Agoraphobia |
| Any anxiety disorder, girls | 38.0% | NIMH, Any Anxiety Disorder |
| Any anxiety disorder, boys | 26.1% | NIMH, Any Anxiety Disorder |
Onset often precedes adulthood
Solmi and colleagues’ meta-analysis, published in 2022, estimated a median onset age of 17 years for anxiety and fear-related disorders. It found 38.1% began before age 14, 51.8% before age 18 and 73.3% before age 25. These are cumulative proportions among people who developed a disorder, rather than percentages of all children at those ages. The pooled category includes disorders with different onset patterns, and the studies used several definitions of onset. A median identifies the middle of the reported distribution without defining a deadline for when anxiety can begin. Solmi et al., Molecular Psychiatry
The recent child diagnosis estimate and the older adolescent lifetime estimate should not be treated as a time trend. Their age ranges, respondents, recall periods and diagnostic definitions differ. Parent reports can identify conditions already recognized in care, while direct adolescent questionnaires may capture distress that adults around them have not noticed. Both forms of information have value when schools and communities assess the support young people need.
Psychology.com’s anxiety screening explains its own questions and scoring. A brief screening score serves a different purpose from these population estimates.
Impact: health, work and cost
Anxiety can affect everyday functioning, work and use of health services. Economic studies capture parts of that burden, with results that depend on the costs included and the comparison group. Comorbidity adds another layer: some research concerns anxiety alone, while other estimates deliberately combine anxiety with depression or broader mood disorders.
Historical annual U.S. cost of anxiety disorders in 1990
Greenberg and colleagues estimated an annual U.S. anxiety disorder burden of approximately $42.3 billion for 1990 in a study published in 1999. This often-repeated figure belongs to that historical costing exercise and its prices, population and diagnostic definitions. It should not be presented as an annual estimate for 2026. The model combined health care spending with workplace and mortality costs and adjusted for demographic characteristics and psychiatric comorbidity. Its value today is as evidence that anxiety had a measurable societal burden long before the pandemic, rather than as a current budget estimate.
- 12 billionWorking days lost to depression and anxiety worldwide
WHO reports an estimated 12 billion workdays lost annually to depression and anxiety together; its standing summary does not specify a data year for this combined total.
- $1 trillionGlobal annual productivity cost of depression and anxiety
WHO’s standing estimate is $1 trillion per year for depression and anxiety together, predominantly reflecting reduced productivity; the summary does not assign this estimate a specific data year.
- 63.0%Lifetime mood disorder comorbidity among people with GAD
Ruscio and colleagues’ 2017 cross-national analysis of World Mental Health survey data found that 63.0% of adults with lifetime DSM-5 generalized anxiety disorder also had a lifetime mood disorder.
- 2.17 timesRelative direct costs among anxiety patients
A systematic review published in 2020, searching studies through November 2018, found direct costs 2.17 times those of comparison participants without anxiety disorders.
- 1.92 timesRelative indirect costs among anxiety patients
The same 2020 review estimated indirect costs at 1.92 times comparator costs, reflecting economic consequences beyond direct treatment expenses.
- 2.52 timesRelative total costs among anxiety patients
Total costs were 2.52 times comparator costs in the 2020 review, with substantial variation between studies that limits any single person’s cost forecast.
Functional impact is broader than a diagnosis count
The impairment results describe how much a condition interferes with important parts of life, including work, household responsibilities and relationships. A less prevalent disorder can still be associated with serious interference among a large share of those affected. Cost ratios add a different perspective, but they depend on which participants and expenses enter the analysis. Direct, indirect and total ratios cannot be added together because they summarize different cost outcomes and study combinations. Neither an economic estimate nor a severity category captures everything a person values about daily life.
Mood disorder comorbidity helps explain why some anxiety research discusses depression at the same time. The direction of that relationship cannot be inferred from a lifetime overlap statistic: either condition may have appeared first, and shared influences may contribute to both. Similarly, the joint WHO work estimate cannot be split into separate anxiety and depression totals using the figures reported here.
Treatment and the care gap
Research supports effective psychological treatment for anxiety, while access remains incomplete. Surveys measure whether people obtain care, and clinical trials compare outcomes under specified conditions. Those are separate questions. A service contact may involve several kinds of support, whereas an effectiveness study defines the intervention, comparison group and follow-up period more closely.
People with anxiety disorders receiving any past-year treatment
Alonso and colleagues’ historical World Mental Health analysis, published in 2018, found that 27.6% of people with a past-year anxiety disorder received any treatment. The 24 surveys, fielded between 2001 and 2015 in 21 countries, assessed care for emotional, mental health or substance-related problems. This broad contact measure can include care that was not specifically directed at anxiety. WHO continues to cite the result in its current anxiety fact sheet, but it remains a pooled historical estimate rather than a new worldwide survey conducted in 2026.
- 9.8%Care meeting the study’s adequacy criteria
Only 9.8% of anxiety cases received possibly adequate treatment in the 2018 analysis, which applied minimum contact and medication-duration criteria rather than directly measuring recovery.
- 41.3%People who perceived a need for care
The same historical analysis found perceived treatment need in 41.3% of anxiety cases, showing that awareness of need and actual service contact are distinct stages.
- -0.74CBT compared with usual care for adult GAD
Papola and colleagues’ 2024 network meta-analysis found a standardized mean difference of -0.74 for symptoms, with negative values favoring CBT over treatment as usual.
- -0.60CBT compared with usual care after treatment ended
At follow-up three to twelve months after the intervention, the 2024 GAD analysis estimated a standardized mean difference of -0.60, supporting persistence of benefit on average.
- -0.51CBT outcomes in adults ages 55 and older
A 2024 Cochrane review found a standardized mean difference of -0.51 versus minimal management immediately after treatment, with low certainty and less clear longer-term benefit.
What an effect size tells us
A standardized mean difference expresses the difference between groups in units of the study’s variability, allowing researchers to combine several symptom scales. A value of -0.74 therefore does not mean that symptoms fell by 74%, that 74% recovered, or that every participant improved. The adult GAD analysis concerns a particular diagnosis and comparison condition. The older-adult review covers a wider anxiety-related group and uses a different comparison. Their estimates provide evidence of average benefit without creating a head-to-head ranking of outcomes by age. Papola et al., JAMA Psychiatry; Hendriks et al., Cochrane Database of Systematic Reviews
The adequacy threshold in the treatment-gap study measures whether a minimum pattern of care occurred. It cannot establish whether a particular course of therapy was appropriate or effective for an individual. Conversely, randomized trial results do not establish how easily people can obtain comparable care in their community. Differences in cost, availability, recognition and continuity of care can separate an intervention’s research results from its reach in everyday services. Alonso et al., Depression and Anxiety
For readers exploring support, Psychology.com’s directory can help locate a licensed therapist. The worry tree worksheet and thought record worksheet explain ways of organizing experiences for reflection or discussion. These resources serve a different purpose from the population surveys and treatment trials summarized here; worksheet use is not counted as adequate treatment by the historical access study.
Trends over time
Several sources document rising anxiety during the pandemic, and the latest public opinion poll still shows widespread anxiousness. The strongest time comparisons come from repeated questions within the same study. A global model, a U.S. symptom survey and a poll about feeling more anxious each measure a different aspect of change.
Modeled pandemic-related increase in anxiety disorder prevalence in 2020
The COVID-19 Mental Disorders Collaborators estimated that the pandemic increased global anxiety disorder prevalence by 25.6% in 2020 (uncertainty interval 23.2% to 28.0%) compared with the modeled level expected without the pandemic. Their Lancet analysis, published in 2021, estimated 76.2 million additional cases. This is a model-based attribution with uncertainty, rather than a direct count of newly diagnosed people. The result describes the pandemic’s first year and cannot establish the size of an ongoing increase through 2026. It also should not be confused with the share of the population who had an anxiety disorder.
- 15.6%U.S. adults with at least mild symptoms in 2019
NHIS estimated 15.6% in the previous two weeks, providing the same-scale baseline for its comparison with 2022.
- 18.2%U.S. adults with at least mild symptoms in 2022
The corresponding NHIS estimate rose to 18.2%; the comparison documents a change but cannot attribute all of it directly to the pandemic.
- 31.4%Anxiety symptoms in late summer 2020
Household Pulse estimated 31.4% during August 19 to August 31, 2020, using a short anxiety screen with a one-week recall period.
- 36.9%Anxiety symptoms in December 2020
The Pulse estimate reached 36.9% during December 9 to December 21, 2020, within the study phases selected for comparison.
- 48%Adults feeling more anxious in 2026
The American Psychiatric Association poll found 48% felt more anxious than the previous year, compared with 43% giving that response in 2025.
- 62%Adults anxious about paying bills or expenses
In the 2026 American Psychiatric Association poll, 62% were somewhat or very anxious about this concern, an opinion measure rather than a disorder prevalence estimate.
| Measure and period | Reported result | Source |
|---|---|---|
| Benzodiazepines recorded at adult outpatient visits, 2003 | 3.8% | Agarwal and Landon, JAMA Network Open |
| Benzodiazepines recorded at adult outpatient visits, 2015 | 7.4% | Agarwal and Landon, JAMA Network Open |
| Monthly antidepressant dispensing rate, ages 12 to 25, January 2016 to December 2022 | 66.3% increase | Chua et al., Pediatrics |
| Growth in that monthly dispensing rate after March 2020 versus before | 63.5% faster | Chua et al., Pediatrics |
Prescription trends have a wider scope than anxiety
The benzodiazepine study, published in 2019, counted outpatient visits with medication recorded, including visits for conditions other than anxiety. The antidepressant study, published in 2024, measured dispensing across indications and drug classes, so it does not establish an SSRI-only trend or a count of anxiety treatment recipients. Its faster-growth figure compares slopes before and after the pandemic began; it is separate from the overall increase across the full study period. Medication records alone also cannot explain why use changed or whether people’s outcomes improved.
The 2026 heading identifies this reference edition, while each statistic retains its actual data period. National disorder prevalence for 2026 cannot be inferred from a poll asking people to compare their feelings with last year. Pulse findings are also sensitive to survey design, recall period and response patterns. A coherent trend requires matching those features, rather than placing every available anxiety percentage on one continuous line.
Common questions
How common are anxiety disorders in the United States?
NIMH reports that 19.1% of U.S. adults had a past-year anxiety disorder in its 2001 to 2003 survey program, while 31.1% had experienced one during their lifetime. Those estimates use a category that includes OCD and PTSD. For more recent symptoms, CDC found that 18.2% of adults had at least mild anxiety during the previous two weeks in 2022. The symptom estimate and the diagnostic estimates use different definitions, so their similar size does not establish a stable rate. NIMH, Any Anxiety Disorder; NCHS, National Health Statistics Reports 213
Is anxiety more common in women than men?
The U.S. surveys compared here consistently show higher reported prevalence among women. In the 2022 NHIS, at least mild anxiety symptoms affected 21.4% of women and 14.8% of men. NIMH’s older 2001 to 2003 GAD estimates were 3.4% and 1.9%, respectively. The size of the difference varies by disorder and measure, so a universal claim that women are exactly twice as likely to have anxiety overstates the evidence. These group differences also leave substantial variation in individual experiences. NCHS, NHIS Table A; NIMH, Generalized Anxiety Disorder
How common is anxiety in children and teenagers?
CDC reports current diagnosed anxiety in 11% of U.S. children ages 3 to 17 in 2023 to 2024, based on parent reports. Its separate NHIS-Teen summary found recent anxiety symptoms in 20% of adolescents ages 12 to 17 during 2021 to 2023. The first measure concerns a recognized condition that is still present; the second asks teenagers directly about recent symptoms. Different age groups, respondents and definitions explain why the figures should be interpreted separately. CDC, Children mental health data
Has anxiety increased since the pandemic?
Some comparable measures show an increase. NHIS found at least mild anxiety symptoms in 15.6% of U.S. adults in 2019 and 18.2% in 2022. A separate global model estimated a pandemic-attributable increase of 25.6% in anxiety disorder prevalence during 2020. The 2026 American Psychiatric Association poll found that 48% felt more anxious than last year, but that question measures perceived change. These sources do not provide a continuous annual diagnostic-prevalence series through 2026. NCHS, National Health Statistics Reports 213; COVID-19 Mental Disorders Collaborators, Lancet; American Psychiatric Association annual poll
Do anxiety treatments work, and how many people receive them?
Trials support psychological treatment benefits, including CBT for adult generalized anxiety disorder. A 2024 analysis found lower symptoms than usual care both immediately after treatment and at later follow-up. Access is a separate issue: a historical 21-country study published in 2018 found that 27.6% of people with an anxiety disorder received any care, and 9.8% received care meeting its minimum adequacy criteria. Those access figures do not measure recovery, and trial averages cannot predict any one person’s response. Papola et al., JAMA Psychiatry; Alonso et al., Depression and Anxiety
How is anxiety related to depression and suicide risk?
WHO identifies anxiety disorders as associated with greater risk of depression, substance use disorders, and suicidal thoughts and behaviors. That association describes a population pattern and cannot predict an individual’s future. Anxiety and depression can occur together, which is why some studies report combined health or work impacts. Support is available when distress includes thoughts of suicide: in the United States, call or text 988 to reach the Suicide and Crisis Lifeline. The statistics on this page do not estimate anyone’s immediate risk. WHO, Anxiety disorders
How we compiled this
This page combines federal surveys, WHO summaries, original survey reports and peer-reviewed studies. Every retained figure was checked against source text fetched on September 13, 2026, with a short quotation preserved in the research bank. Direct downloads were supplemented by web retrieval when agency pages blocked curl. Historical data years remain visible, and survey diagnoses, symptom thresholds, lifetime histories and opinion polls are distinguished. Cost estimates retain their original scope; standardized effects are separate from percentages. Repeated display of a finding does not create a new underlying statistic. The bank contains 85 distinct estimates, including subgroup results. Comparisons across incompatible populations or instruments are avoided. The September 16, 2026 update checked publisher pages for NIMH, CDC, WHO and the American Psychiatric Association and added SAMHSA’s 2025 NSDUH symptom estimates. WHO’s newer GBD edition replaces the earlier global estimate; the change between editions is not presented as a measured time trend. Archived CDC retrieval returned an older edition, so current child figures were checked against the live publisher page. Unchanged historical studies retain their original data periods; blocked PubMed retrievals did not supply replacement figures. Last full review: September 16, 2026.
Journalists and researchers may reuse any statistic with attribution to the original source and a link to Psychology.com.
Cite this source
Fontane Pennock, S. (2026, September 13). Anxiety Statistics 2026. Psychology.com. https://psychology.com/anxiety-statistics/
References
- National Institute of Mental Health. (n.d.). Any anxiety disorder: statistics. National Comorbidity Survey Replication and Adolescent Supplement. Source
- National Institute of Mental Health. (n.d.). Generalized anxiety disorder: statistics. Source
- National Institute of Mental Health. (n.d.). Panic disorder: statistics. Source
- National Institute of Mental Health. (n.d.). Social anxiety disorder: statistics. Source
- National Institute of Mental Health. (n.d.). Specific phobia: statistics. Source
- National Institute of Mental Health. (n.d.). Agoraphobia: statistics. Source
- World Health Organization. (September 15, 2026). Anxiety disorders. Fact sheet citing Global Burden of Disease 2023 estimates. Source
- Terlizzi, E. P., & Zablotsky, B. (2024). Symptoms of anxiety and depression among adults: United States, 2019 and 2022. National Health Statistics Reports, 213. Source
- Centers for Disease Control and Prevention. (August 20, 2026). Data and statistics on children’s mental health. NSCH 2023 to 2024 and NHIS-Teen 2021 to 2023 summaries. Source
- Solmi, M., et al. (2022). Age at onset of mental disorders worldwide: large-scale meta-analysis of 192 epidemiological studies. Molecular Psychiatry, 27, 281-295. Source
- de Jonge, P., et al. (2016). Cross-national epidemiology of panic disorder and panic attacks in the World Mental Health surveys. Depression and Anxiety, 33, 1155-1177. Source
- Ruscio, A. M., et al. (2017). Cross-sectional comparison of the epidemiology of DSM-5 generalized anxiety disorder across the globe. JAMA Psychiatry, 74, 465-475. Source
- Alonso, J., et al. (2018). Treatment gap for anxiety disorders is global: Results of the World Mental Health Surveys in 21 countries. Depression and Anxiety, 35, 195-208. Source
- Papola, D., et al. (2024). Psychotherapies for generalized anxiety disorder in adults: A systematic review and network meta-analysis of randomized clinical trials. JAMA Psychiatry, 81, 250-259. Source
- Hendriks, G. J., et al. (2024). Cognitive behavioural therapy and third-wave approaches for anxiety and related disorders in older people. Cochrane Database of Systematic Reviews, CD007674. Source
- Greenberg, P. E., et al. (1999). The economic burden of anxiety disorders in the 1990s. Journal of Clinical Psychiatry, 60, 427-435. Source
- Konnopka, A., & König, H. (2020). Economic burden of anxiety disorders: A systematic review and meta-analysis. PharmacoEconomics, 38, 25-37. Source
- World Health Organization. (n.d.). Mental health at work. Mental Health, Brain Health and Substance Use programme. Source
- COVID-19 Mental Disorders Collaborators. (2021). Global prevalence and burden of depressive and anxiety disorders in 204 countries and territories in 2020 due to the COVID-19 pandemic. The Lancet, 398, 1700-1712. Source
- Vahratian, A., et al. (2021). Symptoms of anxiety or depressive disorder and use of mental health care among adults during the COVID-19 pandemic: United States, August 2020 to February 2021. MMWR, 70, 490-494. Source
- American Psychiatric Association. (2026). Annual mental health poll finds Americans anxious about current events, personal finances and emerging technology. Source
- UCLA Center for Health Policy Research. (September 9, 2025). The Healthy Minds Study: 2024 to 2025 data report. Study summary and report link. Source
- American College Health Association. (2025). National College Health Assessment IIIb: Graduate/Professional Student Reference Group Data Report, Spring 2025. Item 65A7. Source
- Agarwal, S. D., & Landon, B. E. (2019). Patterns in outpatient benzodiazepine prescribing in the United States. JAMA Network Open, 2, e187399. Source
- Chua, K.-P., et al. (2024). Antidepressant dispensing to US adolescents and young adults: 2016 to 2022. Pediatrics, 153, e2023064245. Source
- Substance Abuse and Mental Health Services Administration. (July 27, 2026). SAMHSA releases annual National Survey on Drug Use and Health: Adult anxiety symptom prevalence, 2025. SAMHSA, 2025 NSDUH national findings
- Substance Abuse and Mental Health Services Administration. (July 27, 2026). SAMHSA releases annual National Survey on Drug Use and Health: Adolescent anxiety symptom prevalence, 2025. SAMHSA, 2025 NSDUH national findings
More statistics and related pages
Talk it through with a licensed therapist
When anxiety feels close to home, Psychology.com’s therapist directory offers a place to explore professional support. Population statistics provide context; a conversation with a licensed therapist can focus on your own experience.
This page is educational information, not a diagnosis or a substitute for professional care. If you are in crisis, call or text 988 (U.S. Suicide & Crisis Lifeline), any time.