
 By
By Reviewed by
In 2024, 11.7% of U.S. children ages 3 to 17 had current diagnosed ADHD, an estimated 7.1 million children, according to HRSA’s National Survey of Children’s Health. CDC’s separate adult survey found current diagnosed ADHD in 6.0% of U.S. adults in 2023. These diagnosis counts depend on recognition and access to assessment. Symptom surveys, prescription totals and longitudinal studies answer additional questions about ADHD, including how symptoms and support needs change over time.
Last full review: September 16, 2026 · sourced from CDC, HRSA, NIMH, original prescription analyses and peer-reviewed population studies.
Ten numbers that define ADHD in 2026
- HRSA estimates that in 2024, 11.7% of U.S. children aged 3 to 17 had current ADHD, an estimated 7.1 million children. HRSA, 2026
- CDC estimates that in 2023, 6.0% of U.S. adults reported current diagnosed ADHD, approximately 15.5 million people. CDC, 2024
- 55.9% of adults with current ADHD in CDC’s 2023 survey received their first diagnosis during adulthood. CDC, 2024
- Danielson and colleagues reported that among children with current ADHD in 2022, 77.9% had at least one other mental, behavioral or developmental disorder. Danielson et al., 2024
- Danielson and colleagues reported that 30.1% of children with current ADHD in 2022 received neither ADHD medication nor ADHD behavioral treatment. Danielson et al., 2024
- 71.5% of adult stimulant users with ADHD reported difficulty filling a prescription because it was unavailable in the year before CDC’s 2023 survey. CDC, 2024
- ADHD medication fills increased 23.8% between 2019 and 2023 in Huskamp and colleagues’ 2025 analysis of national IQVIA dispensing data. Huskamp et al., 2025
- Global persistent adult ADHD prevalence was estimated by Song and colleagues in 2021 at 2.58% in 2020, requiring evidence of childhood onset. Song et al., 2021
- Schein and colleagues’ 2022 U.S. model estimated $122.8 billion in annual excess societal costs associated with ADHD among adults aged 18 to 64 for 2018. Schein et al., 2022
- 9.1% of the MTA childhood ADHD cohort met criteria for sustained untreated remission through its follow-up endpoint, reported by Sibley and colleagues in 2022. Sibley et al., 2022
How common ADHD is
The most useful prevalence estimate depends on age and on what researchers counted. U.S. parent surveys describe children who have received a diagnosis, while adult research also includes symptom-based assessments. Global estimates combine studies with different methods, so their precision on the page can exceed their certainty in everyday use.
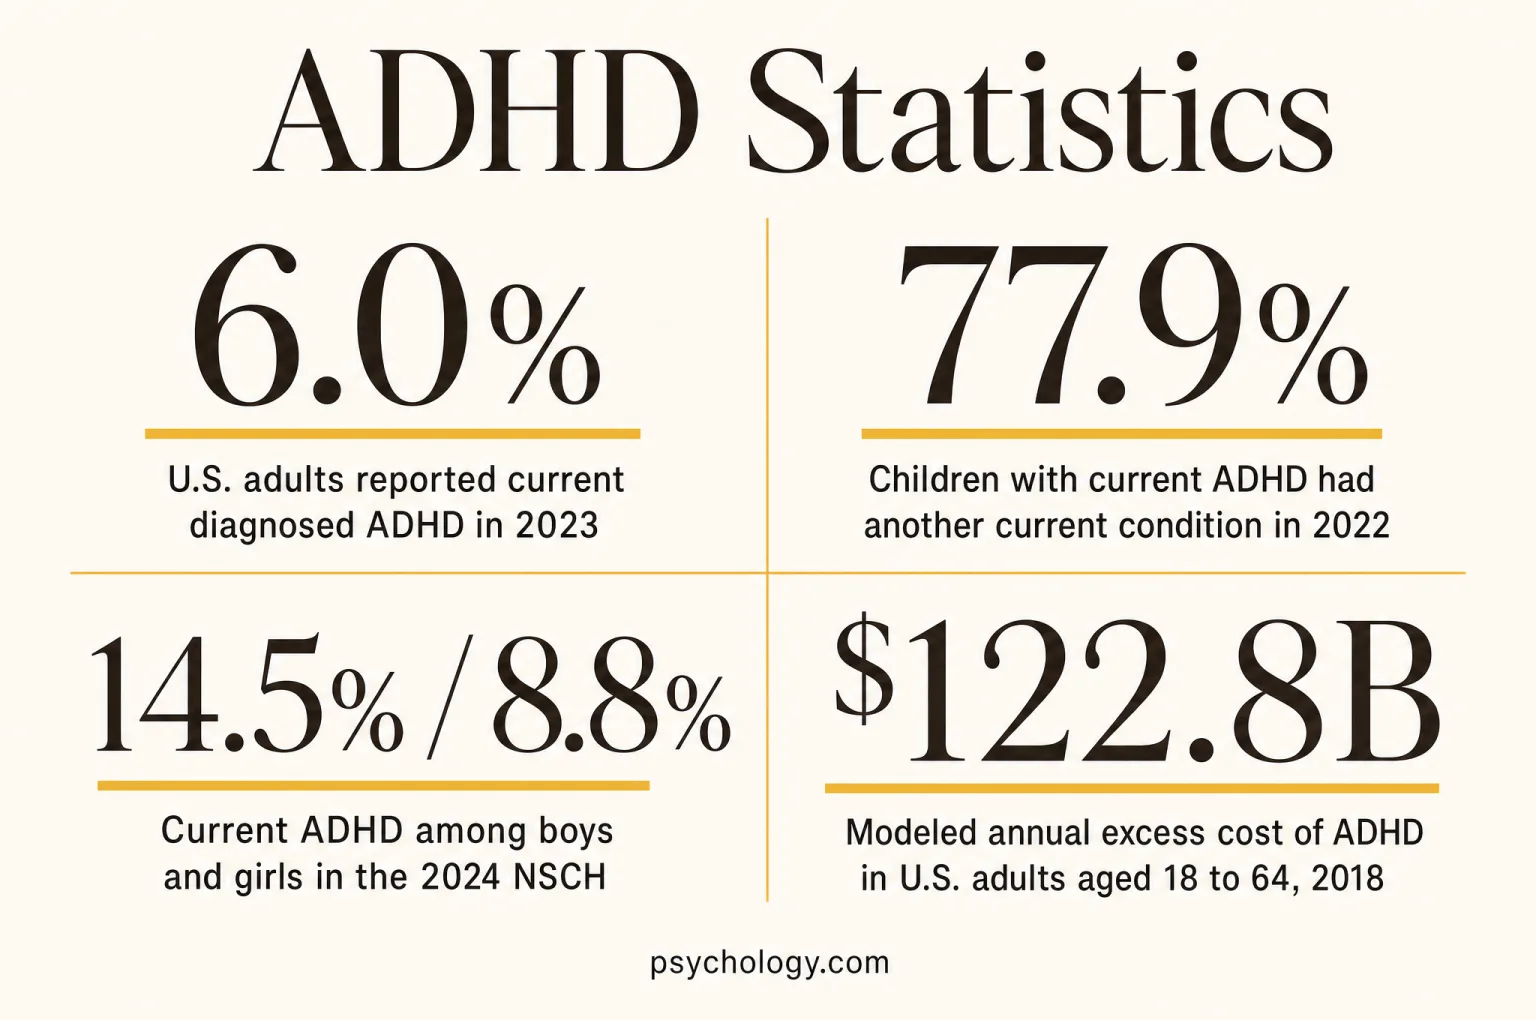
U.S. adults reported current diagnosed ADHD in 2023
CDC’s survey estimated approximately 15.5 million adults with current ADHD. Participants reported a prior diagnosis by a health professional and whether they still had the condition. The estimate covers adults across the adult age range and comes from a weighted rapid survey, with diagnoses unverified against medical records. It describes recognized ADHD and can miss people whose difficulties have never been assessed.
- 11.7%Current ADHD among children in 2024
HRSA estimates 7.1 million U.S. children aged 3 to 17 had current ADHD in 2024, giving schools and services a newer population count than the detailed 2022 treatment study.
- 11.4%Children ever diagnosed in 2022
The 2022 NSCH estimated that 7.1 million children aged 3 to 17 had ever received an ADHD diagnosis, including some whose parents said they no longer had the condition.
- 10.5%Children with current ADHD in 2022
An estimated 6.5 million children aged 3 to 17 had current ADHD in the 2022 NSCH, the denominator used for that study’s severity, co-occurring-condition and treatment percentages.
- 4.4%Historical current adult prevalence
NIMH’s 2001 to 2003 NCS-R estimate applies to adults aged 18 to 44, providing a historical interview-based benchmark whose narrower age range prevents direct comparison with CDC’s 2023 survey.
- 8.1%Historical lifetime adult prevalence
For adults aged 18 to 44 in the 2001 to 2003 NCS-R, lifetime ADHD was more common than current ADHD because the measure also includes earlier periods of the condition.
- 8.7%Historical lifetime adolescent prevalence
In the 2001 to 2004 NCS-A, this share of adolescents aged 13 to 18 met lifetime ADHD criteria, an interview-based estimate distinct from parents reporting a previous professional diagnosis.
| Population or measure | Figure | What it means and source |
|---|---|---|
| Children and adolescents, studies searched from 1978 to 2005 | 5.29% | Polanczyk’s historical pooled estimate helped show how diagnostic methods influence international comparisons. Polanczyk et al., 2007 |
| Children aged 3 to 12, studies searched through 2020 | 7.6% | Salari’s pooled estimate covers a younger population than the adolescent analysis. Salari et al., 2023 |
| Adolescents aged 12 to 18, studies searched through 2020 | 5.6% | The lower adolescent estimate comes from separate study samples and cannot track individual improvement. Salari et al., 2023 |
| Persistent adult ADHD, modeled for 2020 | 2.58% | Song’s age-adjusted estimate requires childhood onset and represents 139.84 million adults worldwide. Song et al., 2021 |
| Symptomatic adult ADHD, modeled for 2020 | 6.76% | Including symptoms regardless of documented childhood onset yields an estimated 366.33 million adults. Song et al., 2021 |
Why prevalence estimates differ
Population surveys can identify difficulties that never appear in healthcare records, while diagnosis-based estimates depend partly on access to assessment. A lifetime measure accumulates earlier diagnoses; a current measure asks about the condition at the time of the survey. The global adult estimates also depend on how researchers establish childhood onset. These differences explain why several credible studies can produce different answers without measuring a single shared quantity. A screening score adds another category: it can describe reported symptoms, but it does not establish the clinical history or impairment required for diagnosis. Psychology.com’s adult ADHD screening questionnaire belongs in that screening category.
Psychology.com’s adult ADHD screening questionnaire provides context for reporting symptoms and understanding a screening result. Its score uses a different method from the professional-diagnosis questions behind the national prevalence estimates.
ADHD in children
Children with ADHD differ in symptom severity, learning needs and the other conditions they experience. The detailed 2022 NSCH findings help describe that range. These are parent-reported categories across a national sample, so they show how often needs overlap without determining which condition explains a particular child’s behavior.
Children with current ADHD had another current condition in 2022
The study counted co-occurring mental, behavioral and developmental disorders, a broad group that includes anxiety, learning disability and autism. That breadth matters: a high combined percentage does not mean every child has another psychiatric diagnosis. It means that ADHD frequently sits alongside other needs, making school support, family experiences and healthcare use more complex than an ADHD label alone can convey.
- 58.1%Moderate or severe ADHD
Parents described this share of children with current ADHD as moderately or severely affected in 2022, indicating that the national diagnosis count includes many children with substantial ongoing difficulties.
- 39.1%Co-occurring anxiety
Among children with current ADHD in 2022, anxiety was a common additional parent-reported condition, helping explain why a child’s experience may involve both attention difficulties and persistent worry.
- 44.1%Behavioral or conduct problems
This was the most common mental, emotional or behavioral co-occurring category in the 2022 study, and its broad wording should be preserved rather than relabeled as a specific conduct-disorder diagnosis.
- 36.5%Co-occurring learning disability
More than a third of children with current ADHD had a parent-reported learning disability in 2022, identifying an additional educational need that cannot be inferred from attention symptoms alone.
- 14.4%Co-occurring autism
The 2022 estimate describes autism among children with current ADHD, a conditional percentage that does not say how common ADHD is among autistic children or among all children.
- 51.0%At least two co-occurring disorders
About half of children with current ADHD had multiple additional disorders in 2022, so adding individual condition percentages would count many of the same children more than once.
| Population or measure | Figure | What it means and source |
|---|---|---|
| Ages 3 to 5 | 2.4% | The youngest group has had less time for symptoms to be recognized and evaluated. Danielson et al., 2024, NSCH 2022 |
| Ages 6 to 11 | 11.5% | Reported diagnosis is more common during the primary-school years. Danielson et al., 2024, NSCH 2022 |
| Ages 12 to 17 | 15.5% | An ever-diagnosed measure includes diagnoses accumulated throughout earlier childhood. Danielson et al., 2024, NSCH 2022 |
How school and home reports fit together
Parents answered whether a health professional had identified the conditions in the survey. Researchers did not independently assess every child or collect a complete educational record. The learning-disability estimate therefore describes a reported additional condition, while a school’s description of classroom needs may use different categories. Severity ratings likewise summarize family perceptions at a particular point in time. They can change as expectations, environments and available support change. These distinctions keep an individual child’s experience separate from a national average. The child ADHD screening questionnaire is a way to organize reported concerns; its results belong outside these diagnosis-based population counts.
Psychology.com’s child ADHD screening questionnaire provides context for reporting symptoms and understanding a screening result. Its score uses a different method from the professional-diagnosis questions behind the national prevalence estimates.
Who is diagnosed: sex, age, race and geography
ADHD diagnosis is uneven across groups. Some differences reflect presentation and recognition; others reflect opportunities to reach healthcare, the survey used and the age range being counted. Race and geography describe patterns in recorded diagnosis, and these patterns alone cannot establish biological differences in how often ADHD occurs.
Current ADHD among boys and girls in the 2024 NSCH
HRSA’s latest brief reports current ADHD for boys and girls aged 3 to 17. Both groups include children across a wide developmental range, and prevalence increased with age in each group. The difference gives a useful view of recognized ADHD, while leaving open how many children in either group have symptoms that have yet to receive an assessment.
- 14.5% / 8.0%Boys and girls in a separate national survey
The 2020 to 2022 NHIS measured ever-diagnosed ADHD among ages 5 to 17, so its sex comparison answers a different question from the 2024 NSCH current-diagnosis comparison.
- 13.4%Non-Hispanic White children
This share of non-Hispanic White children aged 5 to 17 had ever been diagnosed in the 2020 to 2022 NHIS, a record of recognition within that survey population.
- 10.8%Non-Hispanic Black children
The 2020 to 2022 NHIS estimate for Black children aged 5 to 17 was lower than the White estimate, although differences in survey design can produce different patterns elsewhere.
- 8.9%Hispanic children
Hispanic children aged 5 to 17 had this ever-diagnosed prevalence in the 2020 to 2022 NHIS, whose Hispanic category can include children of any race.
- 14.4% / 9.7% / 6.3%Public, private and no health insurance
Ever-diagnosed ADHD in the 2020 to 2022 NHIS was more common among insured children aged 5 to 17, a pattern compatible with healthcare access influencing who receives a diagnosis.
- 6% to 17%State range for ever-diagnosed ADHD
CDC’s pooled 2020 to 2023 estimates for children aged 3 to 17 show substantial state variation, but the range alone cannot separate service access, population characteristics and diagnostic practices.
Why survey definitions matter for disparities
The NSCH and NHIS draw different household samples and use different age ranges and reporting periods. A category such as White can also be defined differently depending on whether Hispanic ethnicity is excluded or reported separately. Comparing a race-only estimate with a race-and-ethnicity estimate can create an apparent disagreement before any real change has occurred. Insurance comparisons need similar care: children in public insurance may differ in income, health needs and eligibility from children with private insurance. The percentages show an association across groups, without identifying a single cause or the rate of undiagnosed ADHD in any group. Reuben and Elgaddal, NCHS, 2024.
The adult evidence adds an important perspective on recognition. In Stockholm healthcare records from 2011 to 2021, females reached their first recorded ADHD diagnosis or ADHD medication later than males, a finding examined in the adult section below. The measure combined diagnosis and medication records, so it should not be presented as the exact age at first diagnosis for all women. Taken together, the child and adult findings support examining who reaches assessment at different life stages, while preserving the local population and the definition used in each study. Skoglund et al., 2024.
Psychology.com’s ADHD screening questionnaire for women offers a separate context for reporting symptoms. The diagnosis figures describe surveyed or recorded populations, and they cannot reconstruct an individual’s clinical history.
Impact: school, work, health and cost
ADHD can affect educational progress, employment and health, but the size of an association depends on the population studied. Cost models put a monetary value on some of these differences. Cohort studies follow outcomes over time, showing average patterns that leave considerable room for individual strengths, support and circumstances.
Modeled annual excess cost of ADHD in U.S. adults aged 18 to 64, 2018
Schein and colleagues combined healthcare claims, research and government data to model annual excess costs associated with ADHD among U.S. adults aged 18 to 64. Unemployment was the largest component, followed by productivity loss and healthcare services. The analysis estimates costs for 2018 using its own prevalence assumptions. These published amounts have not been recalculated with CDC’s newer adult prevalence estimate. They describe a societal model, including indirect costs, rather than national healthcare spending alone. The study was funded by Otsuka.
- $14,092Modeled excess cost per adult per year
The model’s annual estimate for 2018 spreads healthcare and broader economic costs across U.S. adults aged 18 to 64 with ADHD. This amount is neither a typical medical bill nor an individual prediction of lost earnings.
- 12.5% / 3.8%Later-than-expected school graduation
Among Swedish students completing compulsory school in 2008 to 2013, later graduation was more common in the ADHD group than among peers without ADHD, indicating an educational timing difference within that cohort.
- 2.07Adjusted mortality rate ratio
A Danish cohort followed through 2013 found higher mortality with ADHD, with observed rates of 5.85 versus 2.21 deaths per 10,000 person-years and accidents the most common cause of death.
- 38% / 42%Lower crash odds during medicated months
In U.S. insurance records from 2005 to 2014, men and women with ADHD respectively had lower odds of emergency-treated motor vehicle crashes during medicated months in comparisons within the same person.
- 0.79Mortality hazard ratio after medication initiation
Among Swedish patients aged 6 to 64 first diagnosed in 2007 to 2018, medication initiation within three months was associated with lower all-cause mortality over two years. Follow-up ended by 2020; the observational design leaves room for differences between groups.
- 8.3% / 3.2%Unmet need for healthcare in 2024
HRSA found unmet need for any healthcare more often among children with current ADHD than among children without ADHD, covering medical, dental, vision and mental healthcare rather than ADHD treatment alone.
- 31.7% / 26.9%Healthcare costs reported as sometimes or never reasonable
In the 2024 NSCH, parents reported this cost burden for 31.7% of children with current ADHD and 26.9% without ADHD; the measure concerns perceived affordability of healthcare rather than a dollar price for ADHD treatment.
| Population or measure | Figure | What it means and source |
|---|---|---|
| Unemployment | $66.8B | This was the largest modeled component of excess societal cost. Schein et al., 2022 |
| Productivity loss | $28.8B | Work-related effects extend beyond whether someone is employed. Schein et al., 2022 |
| Healthcare services | $14.3B | Direct services form only part of the broader societal estimate. Schein et al., 2022 |
Interpreting risk without predicting a person’s future
Relative measures describe comparisons between groups or periods. They need an absolute rate, a follow-up period and a clear outcome to be meaningful. The Danish mortality study provides person-time rates; the driving study counts crashes resulting in emergency visits, so it misses less serious incidents. Comparisons within the same person reduce some sources of bias, but treatment can still coincide with other changes in health or daily life. Educational outcomes likewise reflect school systems and available support. These studies establish population associations, while a person’s circumstances and future remain more varied than any single ratio can express.
Treatment, medication and the stimulant shortage
Treatment statistics measure receipt, availability and effectiveness in different ways. Some surveys ask about medication now and behavioral treatment during the past year. Pharmacy records count fills, while trials measure symptom change. Keeping those distinctions visible helps explain how rising prescribing and substantial gaps in care can occur together.
Adult stimulant users reported difficulty filling an ADHD prescription
In the 2023 CDC survey, this share of adults with current ADHD who had taken a stimulant in the previous year said their medication had been unavailable when they tried to fill a prescription. The denominator is stimulant users with ADHD, rather than all adults with ADHD. The finding documents a historical access problem and does not establish the availability of a particular product on September 16, 2026.
- 53.6%Children taking ADHD medication in 2022
Among children aged 3 to 17 with current ADHD, just over half were taking medication at the survey date, a receipt measure that does not assess whether treatment met each child’s needs.
- 44.4%Children receiving ADHD behavioral treatment
Parents reported this share had ADHD behavioral treatment during the previous year in the 2022 NSCH, with a broader time window than the survey’s current-medication question.
- 30.1%Children receiving neither measured treatment
In 2022, this share received neither ADHD medication nor ADHD behavioral treatment, although school supports and other services may fall outside the questions used to define these categories.
- 28.2%Children receiving both measured treatments
The original 2022 study’s combination-treatment table reports this percentage, distinguishing children receiving medication plus ADHD behavioral treatment from those receiving only one of the two.
- 33.4%Adults using stimulants in the prior year
In CDC’s 2023 survey of adults with current ADHD, stimulant use was reported by this share, and prescription availability problems were measured within that smaller user group.
- 36.5%Adults receiving neither treatment in the prior year
Among adults with current ADHD in the 2023 survey, this share reported neither an ADHD medication prescription nor ADHD counseling or therapy during the previous 12 months, documenting a gap in measured treatment receipt.
- 31.6% / 11.6%Children with and without ADHD using telehealth in 2024
HRSA reports a past-year telehealth visit for 31.6% of children ages 3 to 17 with current ADHD and 11.6% without ADHD; these visits cover healthcare generally and need not have treated ADHD.
| Population or measure | Figure | What it means and source |
|---|---|---|
| Children and adolescents, methylphenidate | -0.78 SMD | Clinician-rated symptoms favored medication at follow-up closest to 12 weeks. Cortese et al., 2018 |
| Adults, amphetamines | -0.79 SMD | The negative standardized mean difference indicates lower symptom scores with medication. Cortese et al., 2018 |
| Adults, atomoxetine | -0.45 SMD | The average symptom difference favored this nonstimulant medication. Cortese et al., 2018 |
What treatment categories can and cannot tell us
The 2022 child study separately reports medication only at 25.5% and ADHD behavioral treatment only at 16.2%. Its questions do not establish treatment intensity, quality or whether families wanted additional care. The adult measures both cover the previous 12 months: CDC reports 50.4% prescribed ADHD medication and 35.2% receiving both medication and counseling or therapy. Table 2 and its question wording establish that period, even though the narrative describes treatment at the time of the survey. Prescription receipt also differs from reported medication use. Danielson et al., 2024, NSCH 2022; Staley et al., CDC MMWR, 2024.
The trial effects are standardized score differences, so they cannot be read as percentages improved or as the chance an individual will respond. Cortese’s 2018 synthesis also found adverse-effect-related discontinuation differences and insufficient evidence at longer follow-up points. Its results describe short-term average effects. Cortese et al., 2018.
Access also varies geographically. CDC’s pooled 2020 to 2023 state estimates range from 58% to 80% for any ADHD treatment among children with current ADHD. Differences in local services, population needs and survey uncertainty all matter when interpreting that spread. CDC, July 8, 2026.
Readers exploring professional support can use Psychology.com’s directory to find a licensed therapist. The SMART goals worksheet and if-then planning worksheet provide space to organize everyday priorities for reflection or discussion. These practical resources do not establish an ADHD diagnosis or determine which treatment is appropriate for an individual.
Trends 2019 to 2026
Childhood ADHD diagnosis, adult recognition and prescription dispensing have changed since 2019. These developments have different denominators, and publication dates can follow data collection by several years. Recent evidence includes 2024 child diagnosis estimates, a 2023 adult survey and pharmacy comparisons between 2019 and 2023.
Increase in ADHD medication fills from 2019 to 2023
An analysis of national IQVIA data counted 72,849,441 fills in 2019 and 90,183,437 in 2023. These are dispensing events, so a person receiving repeated prescriptions contributes multiple fills. The analysis combines stimulant and nonstimulant categories and cannot determine the diagnosis behind every prescription. It shows growth in medication dispensing, without establishing an equivalent increase in ADHD prevalence.
- 60.1% / 20.4%Growth in nonstimulant and stimulant fills
Between 2019 and 2023, nonstimulant dispensing grew faster in percentage terms than stimulant dispensing, although a larger relative increase does not imply a larger total number of prescriptions.
- 44.1%Stimulant-fill growth among adults aged 31 and older
This group had the largest growth in stimulant fills between 2019 and 2023, highlighting the increasing adult contribution to dispensing without identifying how many recipients were newly diagnosed.
- -6.5%Change in stimulant fills among ages 0 to 18
Stimulant dispensing for ages 0 to 18 fell between 2019 and 2023 in the same national pharmacy dataset. This study includes 18-year-olds in its youngest category, unlike the NSCH surveys on this page.
- 8.8% to 10.5%Current child ADHD in 2019 and 2023
The 2026 analysis of NSCH data found current ADHD diagnosis increased among children aged 3 to 17 after 2019. Its consistent survey definitions support comparison across years, while the repeated cross-sectional design cannot track individual children.
- 62.5% to 53.0%Child medication receipt in 2016 and 2023
Among children with current ADHD, medication receipt declined across this interval, so the share of diagnosed children treated with medication moved differently from the share diagnosed.
- 76.9% to 70.8%Any child ADHD treatment in 2016 and 2023
The decline in measured treatment coverage includes both medication and ADHD behavioral treatment, and it does not establish whether the same children moved into or out of care.
| Population or measure | Figure | What it means and source |
|---|---|---|
| Recorded ADHD patients prescribed stimulants, since 2013 through 2022 | 61% to 64% | Epic found a relatively stable share within its diagnosed patient population. Russell et al., Epic Research, 2023 |
| Initial diagnosis incidence, ages 30 to 49, 2020 and 2022 | 0.34% to 0.64% | Epic’s increase describes new recorded diagnoses within its healthcare population. Russell et al., Epic Research, 2023 |
| Women aged 20 to 24 with a stimulant fill, 2020 to 2021 | 19.2% increase | CDC measured relative growth among commercially insured women in this age group. Danielson et al., CDC MMWR, 2023 |
The shortage timeline and the limits of current data
On August 1, 2023, FDA reported a joint update with DEA on efforts to address prescription-stimulant shortages. The 2023 adult survey provides direct evidence of patients’ difficulty obtaining medication during that period. Neither source establishes that every formulation remained unavailable, or became available, by September 16, 2026. Shortage status depends on the product and date. FDA, August 1, 2023.
Adult ADHD and late diagnosis
For many adults, the diagnosis arrives after childhood, even when difficulties began much earlier. Adult studies also show that symptoms may improve, recur or fluctuate with time. A first recorded diagnosis, a symptom threshold and sustained remission each describe different parts of that experience, and none captures an entire personal history.
Adults with current ADHD were first diagnosed during adulthood
In the 2023 CDC survey, more than half of adults with current ADHD reported diagnosis at age 18 or older. That timing concerns recognition by a professional, rather than the first appearance of symptoms. The result helps explain why adult ADHD services matter even for a condition that begins during development, and why childhood diagnosis counts cannot identify every adult who will later seek assessment.
- 46.0%Adults who had ever used ADHD telehealth
Nearly half of adults with current ADHD in the 2023 CDC survey reported telehealth use for their condition, including services accessed before or during the pandemic period.
- 30.5% / 30.8%Telehealth prescriptions and counseling
Since March 2020, these shares of adults with current ADHD had used telehealth for medication prescriptions and counseling or therapy respectively by the 2023 survey, with possible overlap between groups.
- 23.5 / 19.6 yearsFirst recorded ADHD care in females and males
In Stockholm records from 2011 to 2021, mean age at first recorded diagnosis or ADHD medication was higher for females, a combined care marker rather than a universal age of diagnosis.
- 5.4% / 3.2%Historical current ADHD in men and women
The 2001 to 2003 NCS-R estimated these prevalences among adults aged 18 to 44, providing a historical sex comparison that should not be treated as a current diagnostic gap.
- 9.1%Sustained remission in a childhood cohort
In 2022, the MTA analysis of 558 participants reported full remission at consecutive assessments through the endpoint in this share. The cohort began with childhood combined-type ADHD; remission required low symptoms without ADHD-related impairment or ADHD treatment.
- 63.8%Fluctuating remission and recurrence
Most MTA participants followed a fluctuating course in the 2022 analysis. About 60% of those with initial full remission later had partial or full recurrence, so recurrence did not always mean meeting the full diagnostic criteria again.
| Population or measure | Figure | What it means and source |
|---|---|---|
| Any anxiety disorder | 47.1% | The estimate applies to adults aged 18 to 44 with current ADHD. Kessler et al., 2006 |
| Any mood disorder | 38.3% | This broader category includes mood disorders and should not be relabeled as depression alone. Kessler et al., 2006 |
| Any substance disorder | 15.2% | Co-occurrence indicates overlapping needs; it does not establish that ADHD caused substance problems. Kessler et al., 2006 |
Late recognition and changing symptoms
The MTA enrolled children aged 7 to 9 with combined-type ADHD and assessed outcomes from 2 to 16 years after baseline. Its recovery definition required untreated full remission at two or more consecutive assessments, with no later recurrence through the study endpoint. Full remission required low symptom counts without ADHD-related impairment, with participants receiving no ADHD intervention in the preceding month. This definition describes a research outcome and does not measure all ways treatment can help. The findings cannot automatically be extended to every child with ADHD or adults diagnosed later. Stockholm’s records also reflect a particular healthcare system. Epic’s increase in new diagnoses among women from 2020 to 2022 cannot separate all possible explanations for recognition and access. Sibley et al., 2022; Russell et al., Epic Research, 2023.
Common questions
How common is ADHD in children and adults?
HRSA estimates that 11.7% of U.S. children aged 3 to 17 had current ADHD in 2024. CDC’s 2023 adult survey estimated 6.0% with a self-reported current diagnosis. These estimates come from different surveys and age groups, so they do not describe the same children growing into adulthood. Global estimates also vary by whether researchers require a documented childhood onset or measure current symptoms alone. Robinson et al., HRSA, 2026; Staley et al., CDC MMWR, 2024.
Is ADHD becoming more common?
Recorded diagnosis has increased in recent U.S. child surveys, and adult prescribing has also grown. The NSCH trend analysis reports current child ADHD at 8.8% in 2019 and 10.5% in 2023. Those changes can reflect recognition, healthcare access and other influences as well as underlying symptoms. Prescription growth has a separate denominator because one person can receive multiple fills, and some medications have uses beyond ADHD. Katz et al., 2026.
Why are women sometimes diagnosed with ADHD later?
Later recognition is documented, but its causes vary. In Stockholm records from 2011 to 2021, females reached the first recorded ADHD diagnosis or medication at a mean age of 23.5 years, compared with 19.6 for males. The measure combines diagnosis and prescribing and is specific to that healthcare population. It supports a difference in timing, while providing no universal age at which women receive a diagnosis. Skoglund et al., 2024.
Do children permanently outgrow ADHD?
Some experience sustained remission, while others have changing periods of symptoms and improvement. The MTA analysis reported in 2022 found sustained remission by endpoint in 9.1% and a fluctuating course in 63.8% of its childhood combined-type ADHD cohort. Sustained remission required low symptoms and no ADHD-related impairment without ADHD treatment at consecutive assessments, continuing through the endpoint. These findings distinguish repeated recovery assessments from a single assessment below diagnostic thresholds; they cannot predict every child’s course. Sibley et al., 2022.
What do the stimulant-shortage statistics measure?
The 71.5% figure measures reported difficulty filling an ADHD prescription because medication was unavailable among adult stimulant users with current ADHD in CDC’s 2023 survey. It does not measure the share of all people with ADHD affected, the duration of each interruption or which products were unavailable. It also cannot establish supply conditions in 2026. Product availability and population survey evidence answer different questions at different times. Staley et al., CDC MMWR, 2024.
What do ADHD statistics show about serious health risks?
Cohort research links ADHD with higher accident and mortality rates, while medication studies report associations with lower rates for some outcomes. These comparisons depend on the population, follow-up period and co-occurring conditions; they cannot predict an individual’s future. The Danish study followed participants through 2013 and found accidents were the most common cause of death. If you or someone you know is in crisis or thinking about suicide, call or text 988 in the United States. Dalsgaard et al., 2015.
How we compiled this
Figures were checked against federal data pages, original research articles and PubMed abstracts retrieved through NCBI E-utilities. The collection prioritizes recent U.S. surveys and adds global meta-analyses and longitudinal research for questions those surveys cannot answer. Data years, age groups, diagnosis definitions and treatment denominators are retained. Prescription fills count dispensing events; economic estimates retain the modeled cost year stated by their authors. Observational associations are distinguished from randomized treatment comparisons. Older studies supply historical benchmarks or long-term follow-up, rather than estimates of current national conditions. Overlapping groups are never added together, and secondary summaries are replaced with original study results when their numbers differ. On September 16, 2026, the update checked HRSA’s 2024 NSCH brief, CDC’s current child-data page and the 2023 adult survey against publisher text. HRSA and the child-data page required web retrieval after curl returned access errors. New figures describe telehealth use and parent-reported healthcare affordability. Historical estimates were retained where a fresh source download was blocked, with no inferred replacement values; prescription availability remains specific to the original survey period. Last full review: September 16, 2026.
Journalists and researchers may reuse any statistic with attribution to the original source and a link to Psychology.com.
Cite this source
Fontane Pennock, S. (2026, September 13). ADHD Statistics 2026. Psychology.com. https://psychology.com/adhd-statistics/
References
- Robinson, L., et al. (2026). ADHD prevalence and health care access, 2024. HRSA NSCH data brief. Source
- Centers for Disease Control and Prevention. (2026). Data on ADHD in children. Source
- Staley, B. S., et al. (2024). ADHD diagnosis, treatment, and telehealth use in adults, United States, 2023. MMWR, 73, 890-895. Source
- Danielson, M. L., et al. (2024). ADHD prevalence among U.S. children and adolescents in 2022. Journal of Clinical Child & Adolescent Psychology, 53, 343-360. Source
- National Institute of Mental Health. (n.d.). Attention-deficit/hyperactivity disorder: statistics. Source
- Song, P., et al. (2021). The prevalence of adult attention-deficit hyperactivity disorder: A global systematic review and meta-analysis. Journal of Global Health, 11, 04009. Source
- Polanczyk, G., et al. (2007). The worldwide prevalence of ADHD: A systematic review and metaregression analysis. American Journal of Psychiatry, 164, 942-948. Source
- Salari, N., et al. (2023). The global prevalence of ADHD in children and adolescents: A systematic review and meta-analysis. Italian Journal of Pediatrics, 49, 48. Source
- Reuben, C., & Elgaddal, N. (2024). ADHD in children ages 5 to 17: United States, 2020 to 2022. NCHS Data Brief 499. Source
- Schein, J., et al. (2022). Economic burden of ADHD among adults in the United States: A societal perspective. Journal of Managed Care & Specialty Pharmacy, 28, 168-179. Source
- Jangmo, A., et al. (2019). ADHD, school performance, and effect of medication. Journal of the American Academy of Child & Adolescent Psychiatry. Source
- Dalsgaard, S., et al. (2015). Mortality in children, adolescents, and adults with ADHD: A nationwide cohort study. The Lancet, 385, 2190-2196. Source
- Chang, Z., et al. (2017). Association between medication use for ADHD and risk of motor vehicle crashes. JAMA Psychiatry, 74, 597-603. Source
- Li, L., et al. (2024). ADHD pharmacotherapy and mortality in individuals with ADHD. JAMA, 331, 850-860. Source
- Cortese, S., et al. (2018). Comparative efficacy and tolerability of medications for ADHD: A systematic review and network meta-analysis. The Lancet Psychiatry, 5, 727-738. Source
- Katz, S. M., et al. (2026). Trends in parent-reported ADHD diagnosis and treatment among U.S. children, 2016 to 2023. Journal of Clinical Child & Adolescent Psychology. Source
- Huskamp, H. A., et al. (2025). Recent trends in medication treatment of ADHD. Psychiatric Services, 76, 782-787. Source
- Russell, J., et al. (2023). Number of ADHD patients rising, especially among women. Epic Research. Source
- Danielson, M. L., et al. (2023). Trends in stimulant prescription fills among commercially insured children and adults, 2016 to 2021. MMWR, 72, 327-332. Source
- U.S. Food and Drug Administration. (August 1, 2023). FDA roundup: Joint FDA and DEA stimulant-shortage update. Source
- Skoglund, C., et al. (2024). Time after time: Failure to identify and support females with ADHD. Journal of Child Psychology and Psychiatry, 65, 832-844. Source
- Sibley, M. H., et al. (2022). Variable patterns of remission from ADHD in the Multimodal Treatment Study of ADHD. American Journal of Psychiatry, 179, 142-151. Source
- Kessler, R. C., et al. (2006). The prevalence and correlates of adult ADHD in the United States. American Journal of Psychiatry, 163, 716-723. Source
- Robinson, L., et al. (2026). ADHD prevalence and health care access, 2024. HRSA NSCH data brief, past-year telehealth visits. Robinson et al., HRSA, 2026
- Robinson, L., et al. (2026). ADHD prevalence and health care access, 2024. HRSA NSCH data brief, reported healthcare cost burden. Robinson et al., HRSA, 2026
More statistics and related pages
Talk it through with a licensed therapist
ADHD can affect routines, relationships and work in different ways. Psychology.com’s therapist directory offers a place to explore professional support for the concerns that matter in your life.
This page is educational information, not a diagnosis or a substitute for professional care. If you are in crisis, call or text 988 (U.S. Suicide & Crisis Lifeline), any time.