
 By
By Reviewed by
In the American Psychiatric Association’s 2026 annual poll, 42% of U.S. adults reported loneliness at least once a week. Loneliness statistics describe a gap between the relationships people have and the connection they want. Social isolation describes limited contact, while living alone describes a household arrangement. Someone can experience any combination of these. Their different definitions explain much of the variation between surveys, and they matter when interpreting health risks.
Last full review: September 16, 2026 · sourced from national surveys, WHO, the U.S. Surgeon General, Census data, and peer-reviewed research.
Ten numbers that define loneliness in 2026
- 42% of U.S. adults reported loneliness at least weekly in the American Psychiatric Association’s April 2026 poll, compared with 33% in its 2025 poll. American Psychiatric Association, 2026
- 20% of U.S. adults felt lonely for much of the previous day in Gallup’s August 27 to September 4, 2024, survey of 6,289 adults. Gallup, 2024
- 15.8% is WHO’s 2025 modeled global loneliness estimate for people aged 13 and older during 2014 to 2023, about one in six. WHO Commission on Social Connection, 2025
- 871,000 deaths annually are attributed to loneliness in WHO’s 2025 model for people aged 13 and older during 2014 to 2019. WHO, 2025
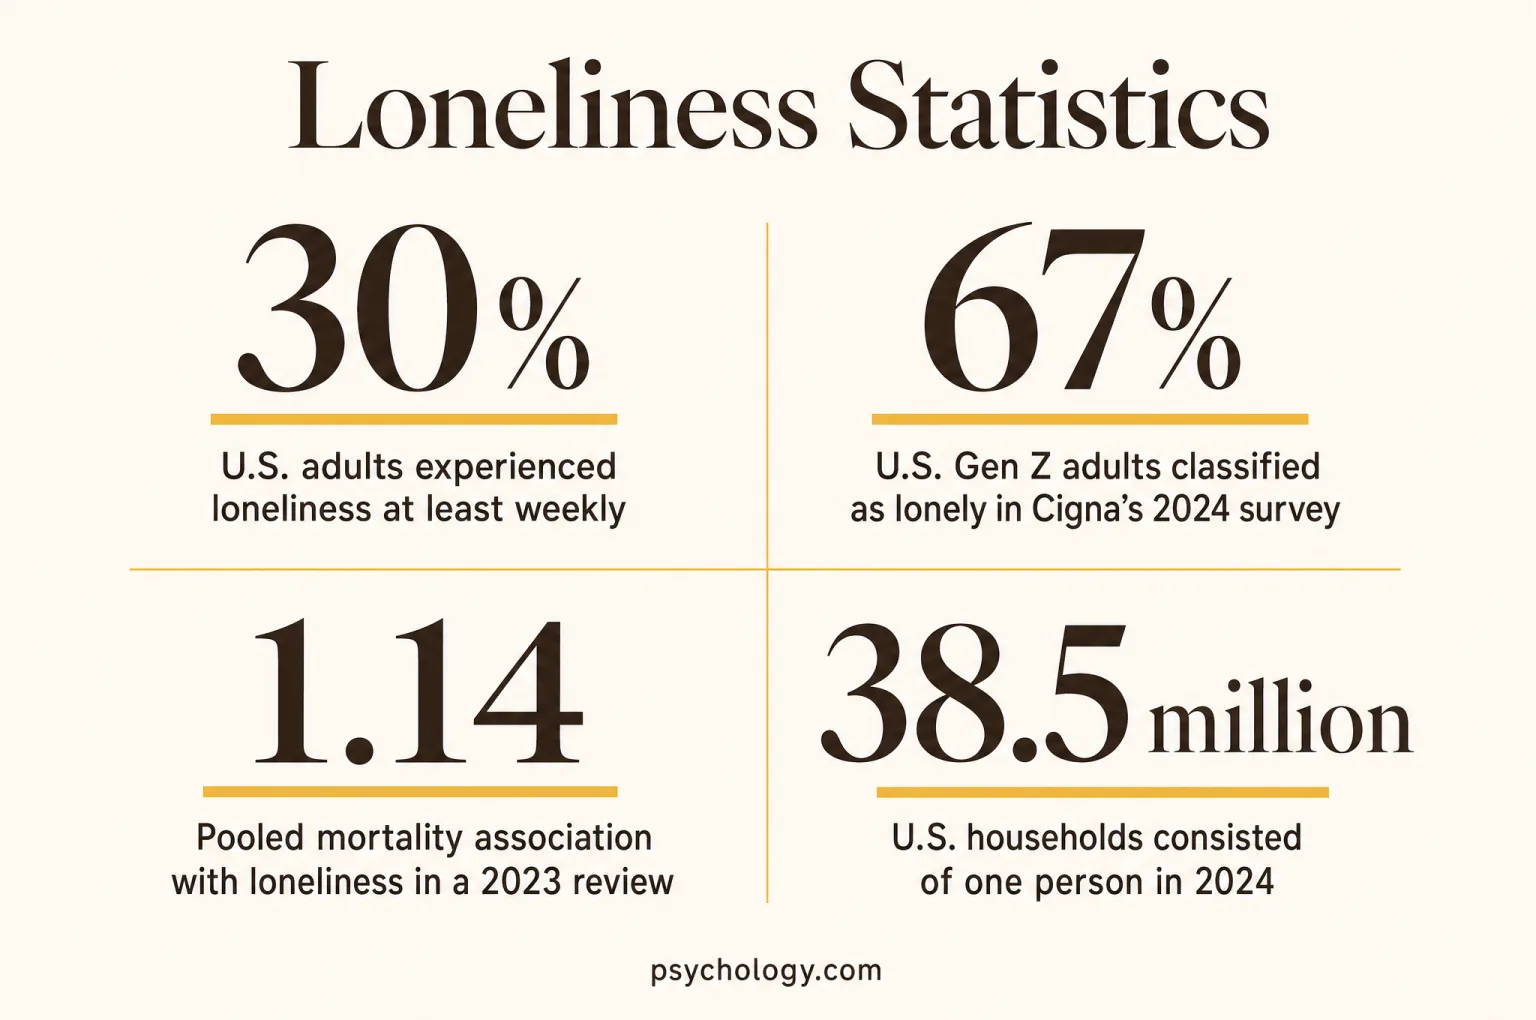
- 67% of U.S. Gen Z adults, born from 1997 to 2006, were classified as lonely in Cigna’s 2024 online adult survey, published in 2025. The Cigna Group, 2025
- 33.4% of community-dwelling U.S. adults aged 50 to 80 lacked companionship some of the time or often in Malani and colleagues’ 2024 JAMA study. Malani et al., JAMA, 2024
- 1.306 was the pooled hazard ratio for dementia associated with loneliness in Luchetti and colleagues’ 2024 meta-analysis. Luchetti et al., Nature Mental Health, 2024
- 81% of U.S. adults classified as frequently or almost always lonely reported anxiety or depression in Harvard’s weighted May 2024 YouGov survey. Harvard Making Caring Common, 2024
- 39.7 million U.S. households consisted of one person in 2025, according to the U.S. Census Bureau, a housing measure that does not establish loneliness. U.S. Census Bureau, 2025
- 25% of U.S. men aged 15 to 34 reported daily loneliness in Gallup's combined 2023 and 2024 World Poll data. Gallup, 2025
How common loneliness is
U.S. surveys consistently find that loneliness is common, but they count different experiences. Some ask about the previous day, others ask how often people felt disconnected over a year. Multi-question scales can identify people who seldom use the word lonely to describe themselves. The estimates need those definitions alongside them.
U.S. adults experienced loneliness at least weekly in 2024
The American Psychiatric Association's poll of 2,200 U.S. adults, fielded January 10 to January 12, 2024, asked adults about loneliness during the previous year. Its weekly estimate captures recurring feelings across that period; it does not mean every respondent felt lonely on the interview date. The same poll found daily loneliness in 10% of adults. A person can have occasional lonely evenings, a recurring weekly difficulty, or persistent distress, and those experiences enter different survey categories. APA here means the American Psychiatric Association, which commissioned the Healthy Minds Monthly poll.
- 20%U.S. daily loneliness, late summer 2024
Gallup surveyed 6,289 U.S. adults aged 18 and older through its probability-based panel from August 27 to September 4, 2024, asking whether they felt lonely for much of the previous day.
- 16%U.S. loneliness or isolation all or most of the time
Pew's September 2024 survey used a frequency question, capturing a more persistent pattern than a measure that includes occasional loneliness.
- 21%U.S. loneliness in Harvard's May 2024 survey
Harvard’s weighted YouGov survey of 1,500 U.S. adults, conducted May 6 to May 14, 2024, counted feeling lonely frequently or almost all the time during the past 30 days.
Batanova, M., Weissbourd, R., & McIntyre, J., 2024; Full report and methods
- 15.8%WHO global loneliness estimate for people aged 13 and older
The Commission’s 2025 report models prevalence during 2014 to 2023, with a 95% uncertainty interval of 12.8% to 20.1%; children under 13 were outside the estimate.
World Health Organization, 2025; WHO Commission report, 2025
- 23%Daily loneliness among people aged 15 and older across 142 countries and areas, 2023
Gallup’s 2023 World Poll asked approximately 1,000 people per country or area about loneliness for much of the previous day; country samples and interview modes varied.
- 61%U.S. loneliness in Cigna's 2019 research
Cigna’s online survey of 10,441 U.S. adults aged 18 and older, fielded July 16 to August 2, 2019, classified UCLA Loneliness Scale scores of 43 or higher as lonely.
- 42%U.S. adults reporting loneliness at least once a week, 2026
The American Psychiatric Association’s annual poll, conducted by Morning Consult from April 13 to April 15, 2026, included 2,201 adults. Its weekly figure rose from 33% in 2025; the question measures recurring loneliness rather than loneliness during the previous day.
American Psychiatric Association: Annual mental health poll, 2026
- 16%U.S. adults reporting loneliness every day, 2026
The same April 2026 poll identified daily loneliness within the broader group reporting it at least weekly. The categories overlap, so adding these percentages would count the daily group twice.
American Psychiatric Association: Annual mental health poll, 2026
| Population and observation period | Estimate | Interpretation and source |
|---|---|---|
| Young adults aged 19 to 29, Meta-Gallup across 142 countries and areas, 2022 to 2023 | 27% | Very or fairly lonely; a young-adult subgroup. Maese, E., 2023 |
| Adults aged 65 and older, Meta-Gallup across 142 countries and areas, 2022 to 2023 | 17% | Same question within the older subgroup. Maese, E., 2023 |
| Low-income countries, WHO, 2014 to 2023 evidence | 24.3% | A country-income category, rather than a household-income category. World Health Organization, 2025 |
| High-income countries, WHO, 2014 to 2023 evidence | 11% | Rounded in WHO's public summary. World Health Organization, 2025 |
Why the surveys give different answers
A scale can ask about feeling left out, lacking companionship, or feeling disconnected without asking someone to adopt a label. A single question is easier to repeat across countries, but its wording and recall period carry more weight. Population coverage matters as well: a survey of employees excludes people outside employment, and a household poll may miss people living in institutions. These design choices mean that the highest and lowest percentages cannot be placed into a chronological sequence and called a change in national prevalence. Cigna's scale methodology and Meta-Gallup's international methods illustrate those differences.
Loneliness also differs from a diagnosis. Survey responses describe an experience, and a population percentage cannot determine whether a particular person has depression, social anxiety, or another condition. Psychology.com's loneliness questionnaire offers a separate way to reflect on feelings of connection; its results should be understood alongside personal circumstances rather than used as a population estimate.
Who is loneliest
Young adults often report more loneliness than older adults, although the pattern depends on the survey. Income, relationship circumstances, and health also matter. Broad age averages can conceal people facing bereavement, disability, financial strain, or a move away from familiar networks. Comparisons are clearest when groups answer the same question.
U.S. Gen Z adults classified as lonely in Cigna’s 2024 survey
Cigna's Loneliness in America 2025 report draws on the 2024 Vitality study and defines its adult Gen Z group by birth years 1997 to 2006. The result describes adults reached by that survey, so it should not be extended to every child or teenager in the generation. The Vitality study surveyed more than 5,000 U.S. adults aged 18 and older online from May 29 to June 14, 2024, with population weighting. Its loneliness classification differs from the brief frequency questions used by some other organizations; the percentages are not directly comparable. Even so, the within-survey age gradient is clear.
- 65%U.S. Millennials classified as lonely, Cigna 2024 data
Respondents born from 1981 to 1996 had a rate close to the Gen Z group, suggesting that disconnection extended well beyond the youngest adults. These are adult subgroups of Cigna’s weighted online survey conducted May 29 to June 14, 2024.
- 60%U.S. Gen X adults classified as lonely, Cigna 2024 data
The estimate for respondents born from 1965 to 1980 shows that a high prevalence also appeared in the middle of adult life. These are adult subgroups of Cigna’s weighted online survey conducted May 29 to June 14, 2024.
- 44%U.S. Baby Boomers classified as lonely, Cigna 2024 data
U.S. respondents born from 1946 to 1964 had the lowest generational estimate. These are adult subgroups of Cigna’s weighted online survey conducted May 29 to June 14, 2024.
- 27%Daily loneliness among U.S. adults in households earning under $24,000
This subgroup comes from Gallup’s February 21 to February 28, 2023, probability-panel survey of 5,167 U.S. adults aged 18 and older; it describes respondents rather than entire households.
- 30%Adults aged 18 to 34 lonely daily or several times weekly
APA's 2024 poll placed frequent loneliness in a substantial young-adult minority, using a narrower age band than Cigna's combined generational comparisons.
- 33.4%Community-dwelling U.S. adults aged 50 to 80 lacking companionship in 2024
Michigan counted feeling this way sometimes or often during the previous year, covering occasional as well as more frequent disconnection.
| Survey and population | Loneliness estimate | What the comparison means |
|---|---|---|
| Pew, U.S. adults younger than 50, 2024 | 22% | Lonely or isolated all or most of the time. Goddard, I., & Parker, K., 2025 |
| Pew, U.S. adults aged 50 and older, 2024 | 9% | The same question among older adults. Goddard, I., & Parker, K., 2025 |
| WHO adolescents aged 13 to 17 worldwide, 2014 to 2023 evidence | 21% | Rounded in WHO's 2025 summary. World Health Organization, 2025 |
Age groups and generations answer different questions
Age describes a stage of life; a generation groups people by birth period. A survey taken at one point cannot separate the effects of growing older from the effects of growing up under different conditions. Cigna's generational results therefore do not show that today's young adults will necessarily become less lonely as they age. The comparison is also sensitive to who participates and how loneliness is defined. The oldest groups in household surveys may exclude people in nursing homes or people unable to complete an interview. Cigna methodology; Michigan study limitations.
Country income and household income describe different comparisons. A person with a low income in a wealthy country belongs to a different category from a resident of a low-income country. The figures establish group differences without assigning a single cause.
Health effects
Loneliness and limited social connection are associated with mortality, cardiovascular disease, and cognitive decline. Most evidence follows people over time rather than assigning them to social conditions. The findings are important population signals, with uncertainty about how much reflects social disconnection itself and how much reflects other health and life circumstances.
Pooled mortality association with loneliness in a 2023 review
Wang and colleagues combined prospective cohort evidence in adults aged 18 and older and reported a pooled all-cause mortality effect estimate of 1.14 for loneliness (95% confidence interval, 1.08 to 1.20). It is a relative comparison with people who were not lonely, rather than the proportion of lonely people who died. The estimate also differs from the frequently quoted 2015 result because the studies and pooling methods differ. These reviews support concern about social disconnection without providing a fixed personal prognosis.
- 1.26Mortality odds ratio associated with loneliness
Holt-Lunstad's 2015 review, searching studies from 1980 through 2014, found higher adjusted mortality odds among lonely participants, the source of the familiar 26% comparison.
Holt-Lunstad, J., Smith, T. B., Baker, M., Harris, T., & Stephenson, D., 2015
- 1.29Mortality odds ratio associated with social isolation
The same 2015 review found higher odds with objectively limited social connection, which it analyzed separately from the feeling of loneliness.
Holt-Lunstad, J., Smith, T. B., Baker, M., Harris, T., & Stephenson, D., 2015
- 1.32Mortality odds ratio associated with living alone
The 2015 review also examined household status, but this association cannot establish that a particular person living alone feels lonely or faces that exact risk.
Holt-Lunstad, J., Smith, T. B., Baker, M., Harris, T., & Stephenson, D., 2015
- 29%Higher relative risk of coronary heart disease
Valtorta's 2016 review of longitudinal evidence published through May 2015 linked poor social relationships with incident coronary heart disease. The included longitudinal studies were set in high-income countries.
Valtorta, N. K., Kanaan, M., Gilbody, S., Ronzi, S., & Hanratty, B., 2016
- 32%Higher relative risk of stroke
The same 2016 analysis found an association with stroke, while leaving open whether interventions to improve connection would reduce cardiovascular events. The included longitudinal studies were set in high-income countries.
Valtorta, N. K., Kanaan, M., Gilbody, S., Ronzi, S., & Hanratty, B., 2016
- 1.306Dementia hazard ratio associated with loneliness
Luchetti's 2024 meta-analysis found a higher rate of dementia over follow-up, with variation between studies in both loneliness measurement and dementia assessment.
| Outcome and source year | Effect estimate | Interpretation and source |
|---|---|---|
| Alzheimer disease, 2024 | HR 1.393 | A relative hazard associated with loneliness. Luchetti, M., et al., 2024 |
| Vascular dementia, 2024 | HR 1.735 | A separate dementia subtype estimate. Luchetti, M., et al., 2024 |
| Cognitive impairment, 2024 | HR 1.150 | A broader cognitive outcome than dementia. Luchetti, M., et al., 2024 |
| Stronger social relationships, 2010 review | 50% higher survival odds | A positive social-relationship comparison. Holt-Lunstad, J., Smith, T. B., & Layton, J. B., 2010 |
| Perceived social support, 2020 NASEM synthesis | 35% higher survival odds | A measure-specific estimate from the 2010 evidence. National Academies of Sciences, Engineering, and Medicine, 2020 |
The comparison with smoking
Drawing on a 2017 synthesis by Holt-Lunstad, Robles, and Sbarra, the Surgeon General’s 2023 advisory compares the mortality impact of lacking social connection with smoking up to 15 cigarettes a day. This compares population-level mortality estimates across different exposures. It does not provide a biological dose conversion. A lonely day does not create the same exposure as smoking a specified number of cigarettes. The wording also concerns social disconnection broadly, which includes more than subjective loneliness. Surgeon General advisory, 2023.
WHO estimates that loneliness accounted for 871,000 deaths annually worldwide among people aged 13 and older during 2014 to 2019. This is a modeled attributable burden: it combines evidence about exposure and mortality to estimate deaths associated with loneliness at population scale. WHO combines loneliness prevalence estimates for 2014 to 2023 with mortality data for 2014 to 2019. This mismatch in time periods is one limitation; the deaths are not counts from death certificates listing loneliness. Health, poverty, disability, and relationship loss can interact, so an estimate of attributable deaths depends on the assumptions used to distinguish those influences. WHO Commission report, 2025.
Loneliness and mental health
Loneliness often accompanies anxiety, depression, and a reduced sense of purpose. A survey can document that overlap without showing which experience began first. The relationship may run in both directions: distress can make connection harder, while unsatisfying relationships can deepen distress. Supportive-contact trials provide a different kind of evidence about whether change is possible.
Frequently lonely U.S. adults reported anxiety or depression in Harvard’s May 2024 survey
Harvard Making Caring Common’s weighted YouGov survey of 1,500 U.S. adults, fielded May 6 to May 14, 2024, found this overlap among those lonely frequently or almost all the time in the prior 30 days. Anxiety and depression were measured with the GAD-2 and PHQ-2 screening questionnaires. The 81% describes this lonely subgroup; it is not a diagnosis rate among all U.S. adults. Screening responses cannot establish that loneliness caused an anxiety or depressive disorder. The finding suggests that a conversation about connection may sit alongside concerns about mood, worry, and everyday life.
Batanova, M., Weissbourd, R., & McIntyre, J., 2024; Full report and methods
- About 75%Lonely adults reported little or no meaning or purpose
Harvard’s May 2024 U.S. survey finding captures a broader concern about daily life and direction, extending beyond the number of people someone sees. The denominator is respondents lonely frequently or almost all the time in the prior 30 days.
- 67%Lonely adults did not feel part of meaningful groups
Harvard’s May 2024 U.S. survey result points to group belonging as a distinct aspect of connection. The denominator is respondents lonely frequently or almost all the time in the prior 30 days.
- 61%Lonely adults reported insufficient close friends or family
This May 2024 U.S. survey response concerns the adequacy of close relationships, which can differ from the size of a contact list. The denominator is respondents lonely frequently or almost all the time in the prior 30 days.
- 65%Lonely adults felt fundamentally disconnected from others or the world
The May 2024 U.S. survey described this as existential loneliness, a broader feeling than being physically alone. The denominator is respondents lonely frequently or almost all the time in the prior 30 days.
- 63%Lonely adults felt their place in the world lacked importance or relevance
Harvard’s May 2024 U.S. survey result links loneliness with a sense of personal significance. The denominator is respondents lonely frequently or almost all the time in the prior 30 days.
- 43%Lonely respondents aged 15 and older also reported anger for much of the previous day
Gallup’s 2023 World Poll across 142 countries and areas found this overlap among respondents lonely for much of the previous day; it cannot establish a causal sequence.
What a randomized telephone study found
In a trial conducted in 2020 and published in 2021, Meals on Wheels clients in Texas were assigned to an empathy-focused calling program or a control group. After four weeks, the intervention group showed a 1.1-point improvement over control on the short UCLA Loneliness Scale. A different loneliness measure, the De Jong scale, showed a 0.32-point improvement, with uncertainty that included no difference. The mixed results across measures matter: the trial supports a short-term benefit on one loneliness scale, while leaving questions about durability and transfer to other populations. Kahlon et al., 2021.
The trial is evidence about a defined program delivered to a particular group during a particular period. It does not establish that every phone call, app, group activity, or digital service reduces loneliness. Outcomes also differ: a program might improve how connected someone feels without changing how many people they know. Psychology.com's social anxiety questionnaire addresses a related but distinct experience, fear or discomfort in social situations, which can coexist with loneliness.
Psychology.com’s personal wellness and crisis plan provides space to record personal priorities and sources of support. People who want professional support can also explore the directory for a licensed therapist. These resources address personal circumstances; the survey percentages do not determine an individual diagnosis or the outcome of a particular service.
Friendship, work and living alone
A household, a marriage, a workplace, and a friendship network describe different forms of social connection. They can overlap, but none guarantees satisfying relationships. The statistics show where contact happens and where loneliness is reported, while leaving room for people who enjoy solitude or feel disconnected in a busy household.
U.S. households consisted of one person in 2024
Census counts households with a single resident, providing a concrete measure of living arrangements. A household count is different from the share of all adults who live alone, since larger households contain more people. It also says nothing directly about the resident's friendships, contact with family, or satisfaction with solitude. Living alone can accompany independence, bereavement, separation, or many other circumstances.
- 29%Share of U.S. households with one person in 2025
The Census estimate is a housing statistic and should not be interpreted as the percentage of Americans who are lonely.
- 54%Adults with close friends who met one through a workplace
The May 2021 American Perspectives Survey included a respondent's own or their spouse's workplace, highlighting the role of routine shared settings.
- 12%Adults reporting no close friends in May 2021
This Survey Center estimate describes friendship networks during the pandemic, rather than all possible sources of emotional support.
- 46%Adults who made a new friend during the previous year
The same 2021 survey found new connections alongside reports of disruption, showing that friendship networks continued to change during the pandemic.
- 39%Single adults reporting loneliness at least weekly
APA's 2024 poll found a higher frequency among single adults, although relationship status alone cannot explain the difference.
- 22%Married adults reporting loneliness at least weekly
The same poll confirms that loneliness also occurs within marriage, where the quality of connection can differ between households.
- 39.7 millionU.S. one-person households in 2025
The Census Bureau’s December 2, 2025 release supplies the newer household count alongside the historical 2024 figure above. It counts living arrangements, so it cannot establish whether residents want more social contact or feel satisfied with their relationships.
What remote-work comparisons can establish
The Gallup results show an association between work location and reported daily loneliness. They do not isolate the effect of changing a worker's location while holding the rest of life constant. Remote work may preserve access to a job, reduce a difficult commute, or change opportunities for informal conversation. A comparison between existing groups cannot determine which of these mechanisms matters most. Loneliness was reported across every work arrangement shown, so the work-location category is only part of the picture. Gallup methodology, 2026.
Perceived support adds another perspective. AIBM’s analysis of the February 2025 U.S. Household Trends and Outlook Pulse Survey reported that 68% of men and 69% of women said they always or usually felt socially and emotionally supported. Those near-equal totals can coexist with differences in whom people approach for support. AIBM, 2025. Psychology.com's friendship questionnaire offers a separate reflection on relationship quality, which a simple friend count leaves largely unmeasured.
For a practical reflection on communication and relationships, the social skills worksheet offers a separate resource. Friendship counts and living arrangements capture only part of connection: whether someone feels understood, included and supported remains a distinct question from how many contacts or housemates they have.
Trends 2018 to 2026
The period contains a pre-pandemic baseline, sharp disruption, partial recovery, and newer international reporting. It does not contain a single continuous loneliness series shared by all organizations. A 2026 publication may describe interviews from 2025, and comparisons across separate studies require more care than comparisons within a stable survey.
U.S. daily loneliness in February 2023
Gallup’s probability-panel web survey of 5,167 U.S. adults aged 18 and older, conducted February 21 to February 28, 2023, found that daily loneliness had fallen from its pandemic highs by February 2023. The later increase shown below means that recovery was uneven. Gallup explicitly notes that this U.S. loneliness series has no pre-pandemic measurement, so it cannot directly establish whether the post-pandemic level returned to a 2019 baseline.
- 25%U.S. pandemic high, most recently recorded in March 2021
Gallup’s national adult panel series identifies this as a pandemic high point, using the same prior-day loneliness question as later readings. The latest of three 25% readings was March 2021.
- 20%U.S. daily loneliness in late summer 2024
Gallup’s August 27 to September 4, 2024, web survey of 6,289 U.S. adults aged 18 and older found a rate above February 2023 and below the pandemic high.
- 61%Cigna loneliness classification in 2019
Cigna’s July 16 to August 2, 2019, online survey of 10,441 U.S. adults aged 18 and older classified UCLA Loneliness Scale scores of 43 or higher as lonely; this result predates pandemic restrictions.
- 33.9%Community-dwelling U.S. adults aged 50 to 80 lacking companionship in 2018
Michigan's earlier observation supplies a pre-pandemic comparison for that specific age group and question.
- 41.4%Community-dwelling U.S. adults aged 50 to 80 lacking companionship in 2020
The early-pandemic survey asked about a shorter recall period, which limits a direct comparison with the other years.
- 37.2%Community-dwelling U.S. adults aged 50 to 80 lacking companionship in 2023
This estimate remained above the 2018 observation, before reaching 33.4% in the 2024 survey.
| Series and observation year | Estimate | What was measured |
|---|---|---|
| U.S. time-use analysis, 2019 | 309 minutes/day | Average time alone, summarized in the 2023 advisory. Office of the U.S. Surgeon General, 2023 |
| U.S. time-use analysis, 2020 | 333 minutes/day | An increase in time alone, without directly measuring distress. Office of the U.S. Surgeon General, 2023 |
| Michigan poll of community-dwelling U.S. adults aged 50 to 80, 2020 | 55.7% | Felt isolated sometimes or often, using the pandemic recall period. Malani, P. N., et al., 2024 |
| Michigan poll of community-dwelling U.S. adults aged 50 to 80, 2024 | 29.2% | Felt isolated sometimes or often over the past year. Malani, P. N., et al., 2024 |
| Global employees aged 15 and older, 2023 | 20% | Lonely for much of the previous day. Gallup, 2026 |
| Global employees aged 15 and older, 2024 | 22% | Lonely for much of the previous day. Gallup, 2026 |
| Global employees aged 15 and older, 2025 | 22% | Lonely for much of the previous day, published in the 2026 report. Gallup, 2026 |
What the 2026 endpoint means
The latest workplace figures here were collected in 2025. They provide an endpoint for a report published in 2026, without implying a measured change during 2026 itself. Michigan used separate samples across years, changed survey panels, and shortened its 2020 recall period. Its results therefore describe repeated population snapshots rather than tracking the same individuals throughout recovery. The authors did not formally test differences between survey years. Gallup, 2026; Malani et al., 2024. The American Psychiatric Association’s annual poll adds an April 2026 observation for U.S. adults, using its separate weekly-frequency measure; that new observation should not be joined to Gallup’s employee series.
Men and young adults
Evidence about men's loneliness changes with age, question wording, and the kind of support being measured. Some surveys find a marked disadvantage among young U.S. men; others find similar overall loneliness among men and women. Friendship counts, emotional support, and feelings of belonging help explain why these findings can coexist.
Young U.S. men reported daily loneliness in Gallup's World Poll
Across the combined 2023 and 2024 data, U.S. men aged 15 to 34 reported loneliness for much of the previous day at a higher rate than young U.S. women or the median for young men across OECD countries. The U.S. results come from random telephone samples of approximately 1,000 residents aged 15 and older per year, with the percentages here calculated for the subgroup aged 15 to 34. This age band includes adolescents as well as adults. It cannot establish that men of every age are lonelier than women across every measure.
- 18%U.S. women aged 15 to 34 reporting daily loneliness
Gallup's combined 2023 and 2024 result uses the same age band and question as its young-men estimate.
- 15%OECD median for daily loneliness among men aged 15 to 34
This is the median country estimate in Gallup's 2023 and 2024 analysis, rather than a population-weighted average across all OECD residents.
- 9%U.S. men reporting no close friends in Pew’s 2023 data
Pew supplied this additional analysis to AIBM for its 2025 report. The two estimates come from different surveys, so the comparison with the May 2021 American Perspectives Survey does not establish a decline in friendlessness.
- 8%U.S. women reporting no close friends in Pew’s 2023 data
The near-equal result concerns friendship counts, which cannot fully describe the support available within those friendships.
- 15%U.S. men reporting no close friends in the May 2021 American Perspectives Survey
AIBM's historical summary cites the American Perspectives Survey; this pandemic-era result should retain its original year.
- 61%U.S. adults aged 18 to 25 reporting serious loneliness in October 2020
This subgroup came from Harvard’s preliminary weighted Mechanical Turk convenience sample of 935 U.S. adults. Serious loneliness meant feeling lonely frequently or almost all the time in the prior four weeks; the estimate has limited generalizability.
Weissbourd, R., Batanova, M., Lovison, V., & Torres, E., 2021
| Generation | 2023 / 2024 | Sources |
|---|---|---|
| U.S. Gen Z adults: born 1997 to 2005 in 2023; 1997 to 2006 in 2024 | 71% / 67% | The Cigna Group, 2023; The Cigna Group & Evernorth Research Institute, 2025 |
| U.S. Millennials, born 1981 to 1996 | 65% / 65% | The Cigna Group, 2023; The Cigna Group & Evernorth Research Institute, 2025 |
| U.S. Gen X, born 1965 to 1980 | 59% / 60% | The Cigna Group, 2023; The Cigna Group & Evernorth Research Institute, 2025 |
| U.S. Baby Boomers, born 1946 to 1964 | 44% / 44% | The Cigna Group, 2023; The Cigna Group & Evernorth Research Institute, 2025 |
Friendship history and survey limits
In the 1990 comparison cited by the Survey Center, 3% of adults reported no close friends. The older survey used telephone interviews while the 2021 survey used an online panel, so mode effects may contribute to the difference. Harvard’s weighted convenience sample of 935 U.S. adults in October 2020 found 36% reporting loneliness frequently or almost all the time in the prior four weeks, but explicitly described its findings as preliminary. Its recruitment through Mechanical Turk makes it a different kind of evidence from a probability-based national panel. Cox, 2021; Harvard, 2021.
Pew's September 2024 survey found that 54% of women and 38% of men would be very or extremely likely to approach a friend for emotional support. That is a difference in intended help-seeking, even where overall loneliness looks similar. Pew, 2025. Psychology.com's men's issues resources provide related context on relationships and emotional well-being. Cigna’s 2023 and 2024 studies used weighted online samples of U.S. adults aged 18 and older. The Gen Z birth-year range expands in 2024 as more members reach adulthood, so the table describes changing adult samples. These figures do not demonstrate statistically significant year-to-year changes.
Common questions
How common is loneliness in the United States?
The American Psychiatric Association found that 42% of U.S. adults experienced loneliness at least weekly in its April 2026 poll, compared with 33% in 2025. Gallup found 20% felt lonely for much of the previous day in late summer 2024. Weekly frequency and prior-day experience measure different things, so the gap between these percentages does not establish a trend. Each estimate needs its survey wording and year. American Psychiatric Association; Gallup.
Which age group is loneliest?
Young adults often have higher reported loneliness, although the exact age pattern depends on the survey. Cigna's 2024 research classified 67% of Gen Z adults as lonely, compared with 44% of Baby Boomers. Meta-Gallup's 2022 to 2023 surveys found 27% of adults aged 19 to 29 very or fairly lonely, compared with 17% among those aged 65 and older. These comparisons describe group averages and cannot predict how an individual's loneliness will change with age. Cigna; Meta-Gallup.
Are men lonelier than women?
Some groups of men report higher loneliness, but the pattern is not consistent across surveys. Gallup found daily loneliness in 25% of U.S. men aged 15 to 34 versus 18% of women that age in its combined 2023 and 2024 data. Pew's broader adult survey found little overall gender difference in frequent loneliness. Its results did show differences in whom people would approach for emotional support, which is a separate question from whether they feel lonely. Gallup; Pew.
Does living alone mean someone is lonely?
Living alone describes a household arrangement; loneliness describes an unwanted gap in connection. Census counted 39.7 million one-person households in 2025, but that statistic does not reveal residents' relationship quality or satisfaction with solitude. People can maintain close friendships while living alone, and they can feel lonely while married or sharing a home. Research also distinguishes social isolation, meaning limited social contact, from the subjective feeling of loneliness. These concepts overlap without being interchangeable. Census; WHO.
Is loneliness as harmful as smoking 15 cigarettes a day?
The Surgeon General's 2023 advisory compares the mortality impact of lacking social connection with smoking up to 15 cigarettes daily. It is a population-level comparison across research findings, rather than an exact conversion between loneliness and cigarette exposure. The advisory refers to social disconnection broadly. The evidence does not mean that a single lonely day carries a fixed amount of damage, or that everyone who feels lonely has the same health outlook. Duration, health, and life circumstances matter. Surgeon General advisory.
How is loneliness related to depression and suicide risk?
Loneliness and mental health difficulties often overlap, but a survey cannot determine an individual's diagnosis or suicide risk. Harvard's May 2024 survey found that 81% of lonely adults reported anxiety or depression; that does not establish a causal sequence or a diagnosed disorder in every respondent. WHO identifies mental health as part of the burden associated with social disconnection. If loneliness accompanies thoughts of suicide or a crisis, call or text 988 in the United States. Harvard; WHO.
How we compiled this
Survey estimates retain their original questions, population boundaries, and data years. Sources include Gallup, Pew Research Center, the American Psychiatric Association, Harvard Making Caring Common, Cigna, Census, WHO, and peer-reviewed studies. Older landmark results are dated explicitly. Mortality and dementia associations are reported using the original effect measure; they are not individual predictions. WHO deaths are modeled estimates, and commercial surveys are attributed to their sponsors. Comparisons across different questionnaires are descriptive. The title identifies the reference edition, rather than implying that all observations were collected during 2026. The September 16, 2026 refresh fetched the American Psychiatric Association’s May 12, 2026 annual-poll release, the Census Bureau’s December 2, 2025 household release, Gallup’s U.S. daily-loneliness article and global workplace tables, and WHO’s 2025 public summary and report landing page. Morning Consult surveyed 2,201 adults from April 13 to April 15, 2026 for the psychiatric association; the release reports a margin of error of 2 percentage points. Census household figures come from the 2025 Current Population Survey Annual Social and Economic Supplement. Earlier survey findings remain explicitly dated for historical context. Last full review: September 16, 2026.
Journalists and researchers may reuse any statistic with attribution to the original source and a link to Psychology.com.
Cite this source
Fontane Pennock, S. (2026, September 13). Loneliness Statistics 2026. Psychology.com. https://psychology.com/loneliness-statistics/
References
- American Psychiatric Association (2024). New APA poll: One in three Americans feels lonely every week. Source
- World Health Organization (2025). Social connection: Questions and answers. Source
- James, M. P., & Witters, D. (2024). Daily loneliness afflicts one in five in U.S. Gallup. Source
- Batanova, M., Weissbourd, R., & McIntyre, J. (2024). Loneliness in America: Just the tip of the iceberg? Harvard Making Caring Common. Source
- Goddard, I., & Parker, K. (2025). Men, women and social connections. Pew Research Center. Source
- Gallup (2026). State of the Global Workplace: Global data summary, 2025 survey data. Source
- Vigers, B. (2025). Younger men in the U.S. among the loneliest in West. Gallup. Source
- U.S. Census Bureau (2024). Nearly two-thirds of U.S. households are family households. Source
- Cox, D. A. (2021). The state of American friendship: Change, challenges, and loss. Survey Center on American Life. Source
- American Institute for Boys and Men (2025). Male loneliness and isolation: What the data shows. Source
- Maese, E. (2023). Almost a quarter of the world feels lonely. Meta-Gallup, 2022 to 2023 surveys. Source
- Holt-Lunstad, J., Smith, T. B., Baker, M., Harris, T., & Stephenson, D. (2015). Loneliness and social isolation as risk factors for mortality: A meta-analytic review. Perspectives on Psychological Science, 10(2), 227-237. Source
- Valtorta, N. K., Kanaan, M., Gilbody, S., Ronzi, S., & Hanratty, B. (2016). Loneliness and social isolation as risk factors for coronary heart disease and stroke. Heart, 102(13), 1009-1016. Source
- Holt-Lunstad, J., Smith, T. B., & Layton, J. B. (2010). Social relationships and mortality risk: A meta-analytic review. PLOS Medicine, 7(7), e1000316. Source
- Luchetti, M., et al. (2024). A meta-analysis of loneliness and risk of dementia using longitudinal data from more than 600,000 individuals. Nature Mental Health, 2, 1350-1361. Source
- Wang, F., et al. (2023). A systematic review and meta-analysis of 90 cohort studies of social isolation, loneliness and mortality. Nature Human Behaviour, 7, 1307-1319. Source
- Office of the U.S. Surgeon General (2023). Our epidemic of loneliness and isolation: The healing effects of social connection and community. U.S. Department of Health and Human Services. Source
- Cigna (2020). Cigna takes action to combat the rise of loneliness and improve mental wellness in America. January 23, 2020; survey conducted July 16 to August 2, 2019. Source
- The Cigna Group (2023). Redefining health through vitality: New insight into five years of loneliness trends. Source
- The Cigna Group & Evernorth Research Institute (2025). Loneliness in America 2025: A pervasive struggle requires a communal response. 2024 survey data. Source
- Malani, P. N., et al. (2024). Loneliness and social isolation among US older adults. JAMA. Published online December 9, 2024; 2025 print issue, 333(3), 254-257. Source
- Weissbourd, R., Batanova, M., Lovison, V., & Torres, E. (2021). Loneliness in America: How the pandemic has deepened an epidemic of loneliness and what we can do about it. Harvard Making Caring Common. October 2020 survey. Source
- Gallup (2024). Over 1 in 5 people worldwide feel lonely a lot. 2023 World Poll. Source
- Witters, D. (2023). Loneliness in U.S. subsides from pandemic high. Gallup. Source
- National Academies of Sciences, Engineering, and Medicine (2020). Social isolation and loneliness in older adults: Opportunities for the health care system. Chapter 3: Evaluating the evidence on mortality. Source
- Kahlon, M. K., et al. (2021). Effect of layperson-delivered, empathy-focused program of telephone calls on loneliness, depression, and anxiety among adults during the COVID-19 pandemic: A randomized clinical trial. JAMA Psychiatry, 78(6), 616-622. Source
- World Health Organization. (2025). From loneliness to social connection: Charting a path to healthier societies. Report of the WHO Commission on Social Connection. WHO Commission report, 2025
- American Psychiatric Association. (May 12, 2026). Annual mental health poll finds Americans anxious about current events, personal finances and emerging technology. Source
- U.S. Census Bureau. (December 2, 2025). Census Bureau releases new estimates on America’s families and living arrangements. Source
More statistics and related pages
Talk it through with a licensed therapist
If loneliness is part of your life, the Psychology.com directory provides a place to explore licensed therapists and their areas of practice.
This page is educational information, not a diagnosis or a substitute for professional care. If you are in crisis, call or text 988 (U.S. Suicide & Crisis Lifeline), any time.