
 By
By Reviewed by
An estimated 48.4 million Americans aged 12 and older had a substance use disorder in 2024, according to SAMHSA. That broad category includes different substances and levels of severity. Overdose deaths have declined in recent national data, and millions of adults report resolving substance problems. Those developments sit alongside a large gap between measured treatment need and care received. The survey covers the civilian, noninstitutionalized population; its estimate is dated to the observation year and should not be interpreted as a count for 2026.
Last full review: September 16, 2026 · sourced from SAMHSA, CDC, NIAAA, NIDA, WHO, national surveys and peer-reviewed research.
Ten numbers that define addiction in 2026
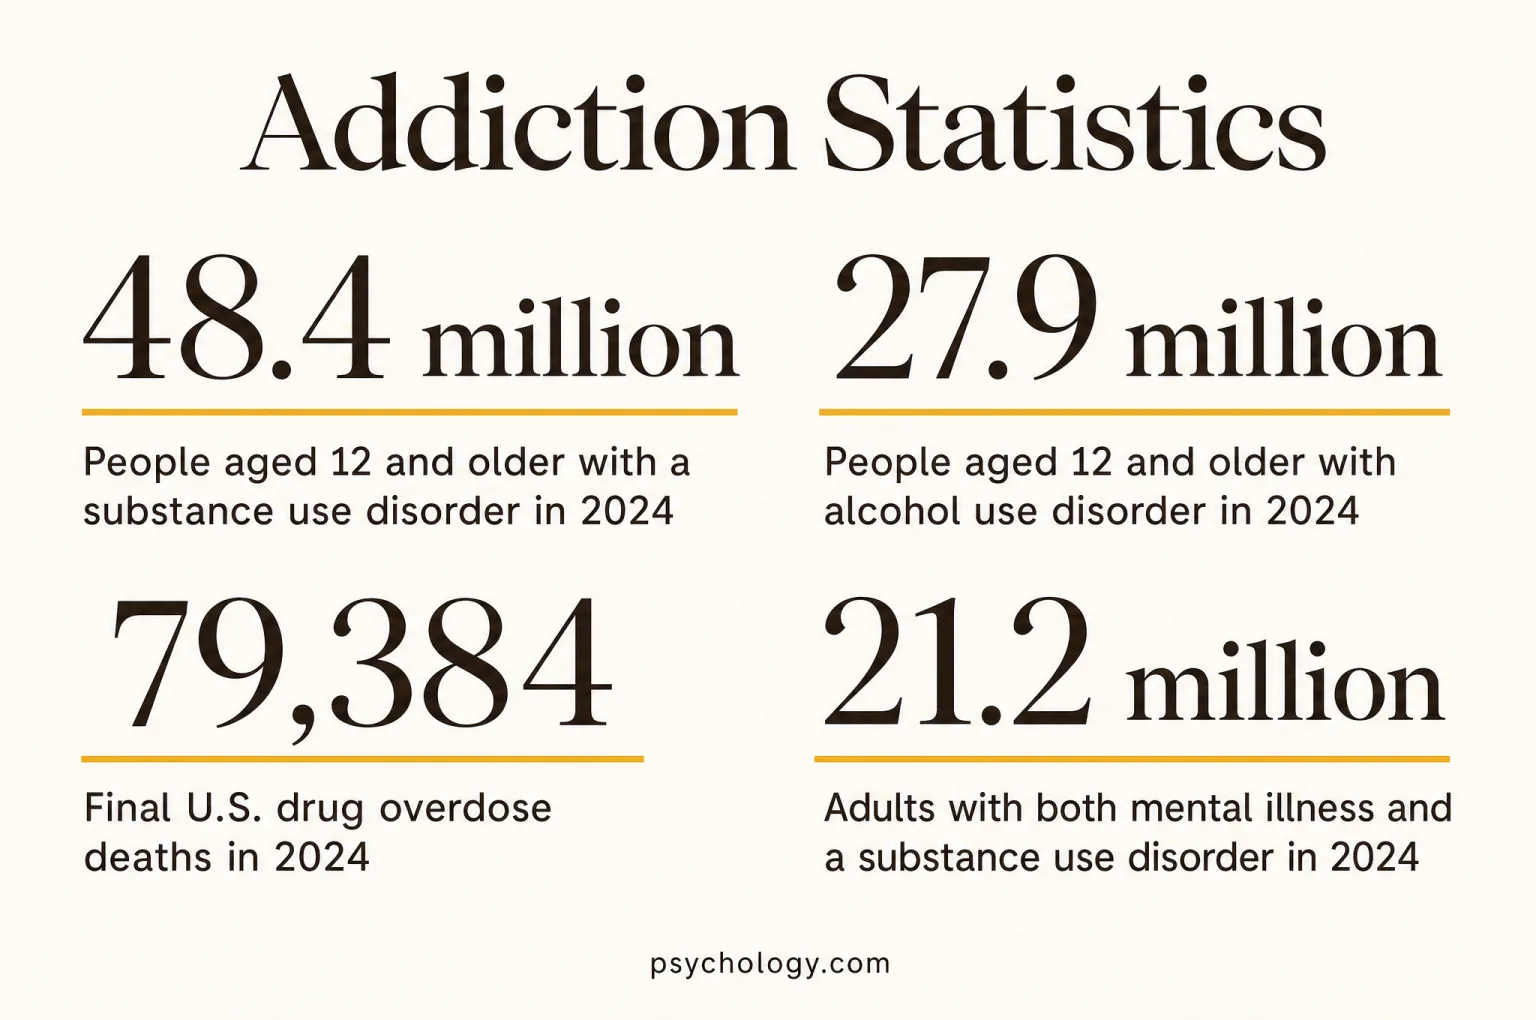
- SAMHSA estimated that 48.4 million Americans aged 12 and older had a past-year substance use disorder in 2024, representing 16.8% of that population. SAMHSA, 2025
- NIAAA reported that 27.9 million people aged 12 and older had alcohol use disorder in 2024; alcohol remains a substantial part of the addiction picture. NIAAA, 2024 data
- SAMHSA estimated that 20.6 million people aged 12 and older had cannabis use disorder in 2024, a survey measure that differs from simply using cannabis. SAMHSA, 2025
- CDC final records show that 79,384 people died from drug overdose in 2024 in final U.S. records; overdose deaths are preventable. CDC NCHS, 2026
- CDC estimated that 69,973 drug overdose deaths were provisionally estimated for 2025 in the release dated May 13, 2026, almost 14% below its provisional 2024 comparison. CDC NCHS, 2026
- CDC estimated that 178,307 deaths a year were attributable to excessive alcohol use during 2020 to 2021, including chronic diseases and injuries. CDC, 2024
- SAMHSA estimated that 21.2 million U.S. adults had both any mental illness and a substance use disorder during 2024, illustrating overlapping care needs. SAMHSA, 2025
- SAMHSA reported that 12.3% of people aged 12 and older with a substance use disorder received substance use treatment in 2024. SAMHSA, 2025
- Kelly and colleagues found that 9.1% of U.S. adults reported resolving an alcohol or drug problem in a 2016 survey, equivalent to 22.35 million people. Kelly et al., 2017
- CDC reported that 1.63 million middle and high school students reported current e-cigarette use in 2024; the survey measures use rather than nicotine dependence. CDC, 2024
How common addiction is
National addiction estimates depend on the definition being counted. Substance use disorder includes alcohol and drug disorders across a range of severity. Gambling problems and nicotine use are measured separately here. An annual prevalence estimate describes people meeting survey criteria during that year, including people whose circumstances changed before the interview.
People aged 12 and older with a substance use disorder in 2024
SAMHSA’s 2024 NSDUH estimate represents 16.8% of the U.S. civilian, noninstitutionalized population aged 12 and older. The survey includes people living in households and some group settings, while excluding people in prisons and other institutions. Its total covers alcohol and drug use disorders, with each person counted once even when multiple substances are involved. It is a broad measure of symptoms and impairment across the population, rather than a register of people who have received a diagnosis or entered treatment.
- 28.2 millionPeople with a drug use disorder in 2024
The 28.2 million estimate covers disorders involving at least one of the drugs assessed by NSDUH; a person can belong to this group and also have alcohol use disorder.
- 7.7 millionPeople with both alcohol and drug disorders in 2024
This overlap explains why separate alcohol and drug disorder totals exceed the overall SUD total when added together, an easy mistake when comparing headline figures.
- 20.6 million / 7.1%People with cannabis use disorder in 2024
SAMHSA estimated 20.6 million people aged 12 and older, or 7.1%, using past-year disorder criteria; frequency of use by itself does not reproduce this measure.
- 4.8 million / 1.7%People with opioid use disorder in 2024
SAMHSA states that its SUD measures do not capture disorders arising solely from illegally made fentanyl use, an important limitation when interpreting the scale of opioid-related harm.
| Measure | Figure | What it means and source |
|---|---|---|
| Severity among people with SUD, 2024 | 55.8% mild; 21.3% severe | The majority fell in the mild category; the broad total should not be labeled severe addiction. SAMHSA, 2024 NSDUH annual national report |
| U.S. adults reporting repeated gambling problem indicators, 2024 | 8% | NGAGE found that 8% of adults reported at least one indicator many times in the past year in 2024; NCPG explicitly says the survey does not estimate gambling addiction prevalence. NCPG, NGAGE 3.0 |
| Global alcohol use disorders among people aged 15 and older, 2019 | 400 million AUD; 209 million dependence | WHO estimates 400 million people with alcohol use disorders in 2019, including 209 million with alcohol dependence. WHO, Alcohol fact sheet, June 28, 2024 |
What a prevalence estimate can tell you
A past-year disorder estimate brings together people at different points in their lives. Some are having persistent difficulties; others have improved or have recently entered care. The count alone cannot reveal those differences, nor can it show whether someone recognizes a problem. Household surveys also reach a different population from treatment-center records, which describe people already connected with services. When a report describes addiction as common, that is a statement about the scale of need across a population. It does not mean that everyone using a substance has a disorder or that everyone with a disorder has the same support needs.
Psychology.com’s drug use screening provide a separate starting point for reflecting on personal concerns; population percentages cannot determine an individual result.
Alcohol
Alcohol use, binge drinking and alcohol use disorder describe different patterns. A person can experience harm without meeting disorder criteria, and a person with a disorder may drink in patterns that a short recall period misses. U.S. alcohol estimates also change when the denominator shifts from everyone aged 12 and older to adults only.
People aged 12 and older with alcohol use disorder in 2024
NIAAA reports that 9.7% of this age group met past-year alcohol use disorder criteria in the 2024 NSDUH. Alcohol use disorder spans a range of severity and is assessed through symptoms, including problems controlling use and its consequences. It is separate from the larger population who report drinking at all. The survey estimate includes people who have never sought care, which makes it useful for understanding needs that treatment records alone would miss.
- 134.3 million / 46.6%People reporting alcohol use during the past month
In 2024, 134.3 million people aged 12 and older reported drinking, representing 46.6% of that population; this measures exposure rather than disorder prevalence.
- 57.9 million / 20.1%People reporting past-month binge drinking
NIAAA reports 57.9 million people aged 12 and older, or 20.1%, in 2024; the measure captures a drinking pattern associated with health and safety risks.
- 14.5 million / 5.0%People reporting past-month heavy alcohol use
The 2024 estimate was 14.5 million people aged 12 and older, or 5.0%; heavy use and binge drinking overlap and are not separate populations to add.
- 900,000 / 3.5%Adolescents reporting past-month binge drinking
Among ages 12 to 17, 900,000 young people, or 3.5%, reported binge drinking in 2024, showing that alcohol-related prevention needs extend below adulthood.
- 7.6%People with AUD who received alcohol treatment
In 2024, 7.6% of people aged 12 and older with past-year AUD received treatment for alcohol use; this is narrower than treatment for any substance.
- 2.5%People with AUD who received medication treatment
NIAAA reports medication receipt among 2.5% of people aged 12 and older with AUD in 2024, illustrating how medication access differs from broader treatment contact.
- 775,000 / 3.0%Adolescents aged 12 to 17 with alcohol use disorder in 2024
NIAAA reports this past-year disorder estimate separately from adolescent binge drinking, making clear that the two questions measure different experiences.
- 27.1 million / 10.3%Adults aged 18 and older with alcohol use disorder in 2024
The adult-only denominator provides a closer match for readers asking how common alcohol use disorder is among adults, while the page headline also includes adolescents.
| Measure | Figure | What it means and source |
|---|---|---|
| Males aged 12 and older with AUD, 2024 | 11.8% | Percentage within the male population; it is not the male share of all cases. NIAAA, Alcohol Use Disorder in the United States |
| Females aged 12 and older with AUD, 2024 | 7.6% | Percentage within the female population, using the same past-year measure. NIAAA, Alcohol Use Disorder in the United States |
| High school students currently drinking, 2023 | 22% | YRBS also found past-month marijuana use in 17% of high school students in 2023. YRBS uses a school sample and a past-30-day question. CDC, YRBS Data Summary and Trends Report 2013 to 2023 |
Reading alcohol measures together
A prevalence table becomes more useful when the reference period stays visible. Drinking during the last month, experiencing symptoms during the last year and ever receiving treatment describe different aspects of someone’s experience. The treatment percentages also use people with AUD as their denominator, rather than everyone who drinks. A lower percentage in that column therefore cannot be interpreted as a lower prevalence of drinking. Age coverage matters too: a survey of high school students includes a different group from a household survey of adolescents, and both differ from a survey restricted to adults.
For readers exploring their own relationship with drinking, Psychology.com’s alcohol screening sits alongside these population estimates as a separate resource.
Drugs and overdose deaths
National overdose deaths declined after their recent peak, but the remaining toll is substantial. Death records measure fatal events, while household surveys measure substance use and symptoms among living respondents. The two sources answer different questions. Deaths involving several substances appear in multiple drug categories, so those categories cannot be summed.
Final U.S. drug overdose deaths in 2024
Final CDC records show an age-adjusted overdose death rate of 23.1 per 100,000 in 2024. These deaths are preventable, and the national decline is meaningful. The total covers all drug overdoses, including deaths involving more than one substance. A falling national count does not identify which prevention efforts produced the change or establish that risk declined equally in every community. Final counts also differ from earlier provisional estimates because records and classifications continue to be completed.
- 47,735Deaths involving synthetic opioids other than methadone
The 2024 total was 47,735, with an age-adjusted rate of 14.3 per 100,000; this category includes fentanyl and other synthetic opioids.
- 28,722Deaths involving psychostimulants with abuse potential
The 2024 total was 28,722, or an age-adjusted 8.5 per 100,000, in a category that includes methamphetamine.
- 21,945Deaths involving cocaine
There were 21,945 cocaine-involved overdose deaths in 2024, with an age-adjusted rate of 6.3 per 100,000; some also involved other drugs.
- Nearly 70%Stimulant deaths also involving illicitly manufactured fentanyl
NIDA reports that nearly 70% of stimulant-involved overdose deaths in 2023 also involved illicitly manufactured fentanyl, emphasizing overlap in the mortality data.
- 30.6%Cannabis disorder among users in a historical study
Hasin’s 2012 to 2013 survey found DSM-IV marijuana use disorder among 30.6% of past-year adult users; this was not a lifetime transition probability.
| Measure | Figure | What it means and source |
|---|---|---|
| Synthetic-opioid deaths, 2023 | 72,776 | The category is broader than fentanyl alone. NIDA, Drug Overdose Deaths: Facts and Figures |
| Cocaine-involved deaths, 2023 | 29,449 | NIDA reports the national death-certificate count. NIDA, Drug Overdose Deaths: Facts and Figures |
| Opioid use disorder, 2024 | 4.8 million | A household-survey estimate with exclusions described above. SAMHSA, 2024 NSDUH annual national report |
Why fentanyl figures need precise labels
The phrase “fentanyl deaths” is sometimes used for all deaths involving synthetic opioids other than methadone. That shorthand narrows the label beyond the actual category. Likewise, a drug mentioned on a death certificate may have been present alongside another substance. The total number of overdose deaths provides the unduplicated national count, while drug-specific figures help describe the changing substances involved. Neither count should be used to calculate an individual’s probability of death from a household-survey prevalence estimate.
Who is most affected: age, sex, race and co-occurring conditions
The groups with the highest disorder prevalence are not always the groups with the highest overdose mortality. Age patterns also differ between substance use, disorder symptoms and deaths. Co-occurring mental illness adds another dimension, while broad racial categories can conceal differences in access to services, geography and exposure to harm.
Adults with both mental illness and a substance use disorder in 2024
SAMHSA estimated that 21.2 million adults experienced both any mental illness and SUD during the past year. This describes overlapping needs across the year, without establishing that symptoms were present at exactly the same time or that one condition caused the other. The estimate includes a broad range of mental illnesses. For families and services, the overlap helps explain why separate mental health and substance use statistics can describe many of the same people.
- 25.9%Young adults aged 18 to 25 with SUD
The 2024 past-year prevalence was 25.9%, making young adulthood a period of substantial need even though this age group does not have the highest overdose death rate.
- 7.8%Adolescents aged 12 to 17 with SUD
SAMHSA estimated past-year SUD in 7.8% of adolescents in 2024; the figure concerns disorder symptoms rather than any experimentation with alcohol or drugs.
- 44.2 per 100,000Overdose death rate among adults aged 35 to 44
The 2024 rate was 44.2 deaths per 100,000, the highest among the age groups examined in the CDC report.
- 32.2 vs 14.1Overdose death rates by sex
Age-adjusted rates in 2024 were 32.2 per 100,000 males and 14.1 per 100,000 females, using population denominators rather than percentages of overdose deaths.
- 51.6 per 100,000Overdose mortality among American Indian and Alaska Native people
The age-adjusted 2024 rate for the non-Hispanic group was 51.6 per 100,000; racial misclassification on death certificates can understate mortality in this population.
Group differences need context
An age-adjusted death rate allows comparison between populations with different age structures. An age-specific rate describes one age band directly. Neither identifies the reasons for a difference between groups. Racial categories in national records are especially broad, and they should not be read as biological explanations for addiction. Household survey responses, access to care and death-certificate reporting each have limitations. These estimates can help locate unequal burdens while leaving the causes of those inequalities for studies designed to investigate them.
Impact: health, cost and criminal justice
The impact of substance misuse extends beyond diagnosed disorders and overdose deaths. Alcohol contributes to chronic disease and injury, economic models include costs outside health care, and prison surveys describe substantial unmet needs before admission. These measures cover different years and populations, so they provide context rather than a single combined estimate.
Annual deaths attributable to excessive alcohol use in 2020 to 2021
CDC estimated this average annual toll across 2020 to 2021 by including both fully and partially alcohol-attributable causes. The estimate includes chronic diseases and injuries, which is why it is much broader than deaths explicitly coded as alcohol poisoning or alcohol use disorder. It is a historical annual average, rather than a count for 2026. Alcohol-attributable deaths are preventable, and the size of this estimate shows why alcohol remains central to discussions of substance-related harm.
- $249 billionU.S. economic costs of alcohol misuse in 2010
NIAAA cites $249 billion across health care, lost productivity, crime and other losses; the estimate describes historical economic burden rather than current government spending.
- $31 billionAlcohol-associated liver disease costs in 2022
NIAAA reports a $31 billion U.S. estimate for this specific condition, illustrating how a narrower disease-cost model differs from total alcohol-related economic burden.
- More than $193BDrug-related economic costs in 2007
The 2016 Surgeon General report cites more than $193 billion associated with drug disorders and illegal or nonprescribed drug use, a historical estimate with broad cost categories.
- 49% and 32%Pre-admission SUD among state and federal prisoners
In the 2016 survey, 49% of eligible state prisoners and 32% of eligible federal prisoners met DSM-IV SUD criteria during the year before admission.
BJS, Alcohol and Drug Use and Treatment Reported by Prisoners, 2021
- 2.6 millionGlobal alcohol-attributable deaths in 2019
WHO estimated 2.6 million deaths worldwide, showing the international scale of alcohol-related harm while using a different model and population from the U.S. estimate.
| Measure | Figure | What it means and source |
|---|---|---|
| Binge drinking’s share of 2010 alcohol costs | Three quarters | Costs can extend beyond people with a diagnosed disorder. NIAAA, Economic Burden of Alcohol Misuse |
| Annual male and female alcohol-attributable deaths, 2020 to 2021 | 119,606 and 58,701 | These are sex-specific counts within the U.S. total. Esser et al., CDC MMWR, 2024 |
| Growth in annual alcohol-attributable deaths | 29.3% | Compares averages for 2016 to 2017 and 2020 to 2021. Esser et al., CDC MMWR, 2024 |
Interpreting costs and prison estimates
The Surgeon General’s 2016 report summarizes substance-related annual costs as more than $400 billion. Its alcohol and drug components come from different historical years, so adding them does not produce a current annual budget. Prison prevalence also needs its denominator: the BJS analysis excluded people incarcerated throughout the entire year before admission. The measure uses older diagnostic criteria and retrospective reports. It establishes substantial pre-admission need in that eligible group without showing that substance use caused each person’s offense.
Treatment, recovery and the treatment gap
Treatment receipt is only one part of the recovery picture. Surveys distinguish professional care from community support, medication from other services, and measured need from a person’s own perception of need. Research on people who have resolved problems offers another perspective, including pathways that do not involve formal treatment.
People with a substance use disorder who received treatment in 2024
SAMHSA reports this percentage among people aged 12 and older who met past-year SUD criteria. The treatment definition includes inpatient and outpatient services, medication, telehealth and care received in correctional settings. It does not capture every form of peer or community support as treatment. Receipt also tells us little about the duration or quality of care. The finding describes a large gap between meeting survey criteria and having contact with the services counted.
- 87.7%People with SUD who received no treatment
In 2024, 87.7%, or 42.4 million people aged 12 and older with SUD, did not receive substance use treatment under NSDUH’s definition.
- 17.0%People with OUD receiving medication
In 2024, 17.0% of people aged 12 and older with past-year OUD received medication for it; this denominator differs from everyone receiving opioid-related care.
- 95.6%Untreated adults who did not perceive treatment need
Among the 40.7 million adults aged 18 and older with SUD who did not receive treatment in 2024, 95.6% did not perceive a need for treatment, meaning they neither sought it nor thought they should get it.
- 5.4%People with SUD receiving treatment by telehealth
The 2024 proportion was 5.4%; telehealth overlaps with overall treatment receipt and should not be added as an additional group of people receiving care.
- 9.1%Adults reporting resolution of an alcohol or drug problem
Kelly’s 2016 national survey estimated 9.1%, or 22.35 million adults; the outcome was self-reported problem resolution rather than a clinical follow-up recovery rate.
- More than 1.9MRetail naloxone prescriptions dispensed in 2024
CDC reports more than 1.9 million prescriptions, a measure that excludes important distribution outside retail pharmacies and does not count unique people protected.
- 19.9% vs 68.4%Medication receipt among treated adults aged 18 to 25 versus 35 to 49, 2022
CDC found these percentages among adults who needed and received OUD treatment; the comparison describes medication use within treatment, rather than the chance of entering treatment.
- 51.0% vs 39.5%Medication receipt among treated men versus women, 2022
Among adults needing and receiving OUD treatment, medication receipt differed by sex; these descriptive percentages do not isolate the reasons for the difference.
| Measure | Figure | What it means and source |
|---|---|---|
| Identified as being in recovery | 46% | Identity and reported problem resolution were distinct. Kelly et al., 2017 |
| Used an assisted pathway | 53.9% | Includes lifetime treatment or recovery-support services. Kelly et al., 2017 |
| Used mutual-help groups | 45.1% | Reported supports overlap across these rows. Kelly et al., 2017 |
| Used professional treatment | 27.6% | This does not measure treatment effectiveness. Kelly et al., 2017 |
Why medication coverage estimates differ
A separate CDC analysis of 2022 data found medication receipt in 25.1% of adults classified as needing OUD treatment. Its definition included people receiving medication without meeting past-year OUD criteria, so it differs from the disorder-only denominator above. Naloxone dispensing is a separate prevention measure: it should not be counted as ongoing OUD treatment. These distinctions explain why superficially similar access percentages can answer different questions.
Psychology.com’s addiction recovery worksheets offer educational materials alongside the statistics on formal and community support.
The relapse prevention plan and urge surfing worksheet provide educational materials for organizing experiences and questions. People seeking professional support can use Psychology.com to find a licensed therapist. These resources have a different purpose from population statistics, which cannot determine an individual care plan.
Trends 2019 to 2026
The recent picture combines falling overdose mortality, lower youth use of several substances and continuing treatment gaps. A page updated in 2026 still relies on earlier survey years because national reports take time to compile. Trends are clearest when the population, survey methods and status of mortality records stay consistent.
Predicted overdose deaths in the year ending March 2026
CDC’s release dated August 31, 2026 reported this rolling annual estimate, a 12.3% decrease from the matching period a year earlier. It covers months in both 2025 and 2026 and remains provisional. It therefore cannot be labeled a full-year 2026 death count. The continued decline provides evidence of progress, while the remaining preventable deaths underline the ongoing need for treatment and overdose prevention.
- 48.5 millionPast-year SUD in the original 2023 report
SAMHSA reported 48.5 million people aged 12 and older, or 17.1%; the 2024 report keeps 17.1% for 2023 and states that 2021 to 2024 estimates are not comparable with 2020 or earlier years.
- 20.4 millionCo-occurring mental illness and SUD in 2023
The original report estimated 20.4 million adults, compared with 21.2 million in 2024; those counts alone do not establish a statistically significant increase.
- 69,973Provisional overdose deaths for calendar 2025
The release dated May 13, 2026 estimated 69,973 deaths, almost 14% below its provisional 2024 comparison; later releases can revise both years.
- 26.2%Decline in the final age-adjusted overdose death rate
CDC reports a 26.2% decrease from 2023 to 2024; percentage changes in rates can differ from percentage changes in raw death counts.
- 2.25 millionStudents currently using any tobacco product in 2024
NYTS estimated 2.25 million middle and high school students, a decline from 2023 that was largely driven by lower e-cigarette use.
- 30%Sports bettors reporting parlay betting in 2024
NCPG reports 30%, compared with 17% in 2018; this change concerns betting behavior and does not measure a change in gambling disorder prevalence.
| Measure | Figure | What it means and source |
|---|---|---|
| 2019 | 70,630 | Pre-pandemic national baseline. CDC NCHS, Data Brief 549 |
| 2023 | 105,007 | Completed national mortality records. CDC NCHS, Data Brief 549, reviewed January 29, 2026 |
| 2024 | 79,384 | Completed national mortality records. CDC NCHS, Data Brief 549, reviewed January 29, 2026 |
Changes in prevention access and youth smoking
Retail naloxone dispensing rose from 0.3 prescriptions per 100 people in 2019 to 0.6 in 2023 and remained at 0.6 in 2024, according to CDC. These data do not measure all community distribution. In 2024, cigarette use reached 1.7% among high school students and 1.1% among middle school students in NYTS. These indicators describe different developments, and neither alone explains the national change in overdose mortality.
Common questions
How many Americans have an addiction?
SAMHSA estimated that 48.4 million people aged 12 and older had a substance use disorder in 2024, or 16.8% of that population. The estimate includes mild, moderate and severe disorders involving alcohol or drugs. It does not count every behavioral addiction, and it should not be treated as a count of people with severe addiction alone. Alcohol and drug disorders overlap within the total, so adding their separate counts would count some people twice. SAMHSA, 2024 NSDUH report.
Does drinking or using cannabis mean someone has an addiction?
Substance use and substance use disorder are different survey outcomes. A person can report drinking or using cannabis without meeting the criteria for a disorder. NSDUH assesses patterns of symptoms and impairment over the past year, while many youth surveys ask whether a substance was used during the past month. The older Hasin study found cannabis use disorder among 30.6% of past-year users in 2012 to 2013 using DSM-IV criteria. That historical percentage is not a current estimate for everyone who tries cannabis. Hasin et al., 2015.
Why do estimates of the addiction treatment gap differ?
The denominator changes the answer. SAMHSA separately reports treatment among people with a past-year disorder and among everyone classified as needing care, including people who received treatment without meeting past-year disorder criteria. Alcohol-only treatment and medication receipt are narrower measures again. In 2024, 12.3% of people with a substance use disorder received substance use treatment. A treatment-gap estimate also does not measure whether the care was timely, sustained or helpful, or whether someone used community support outside the survey definition. SAMHSA, 2025.
How many people recover from alcohol or drug problems?
Kelly and colleagues estimated that 9.1% of U.S. adults, equivalent to 22.35 million people, had resolved an alcohol or drug problem in a survey conducted in 2016. Among respondents reporting resolution, 46% identified as being in recovery. The distinction matters because people describe change in different ways. The study included people with and without formal treatment histories and did not follow newly diagnosed patients to calculate their chance of recovery. It supports the conclusion that problem resolution is common, while leaving individual outcomes open. Kelly et al., 2017.
Are overdose deaths still falling in 2026?
The CDC release dated August 31, 2026 reported a predicted 67,798 overdose deaths during the 12 months ending March 2026, a 12.3% decline from the matching period a year earlier. This rolling estimate includes months in two calendar years. It is provisional and can change as death records arrive. Final 2024 records and provisional 2025 estimates also show national declines, but national totals cannot establish what is happening in every community or explain the contribution of any single policy. CDC, August 31, 2026.
Where is support available when addiction is linked with a crisis?
Substance use concerns can occur alongside emotional distress, and population statistics cannot assess an individual emergency. Overdose deaths are preventable, and urgent support is available. In the United States, call 911 for a suspected overdose or another immediate medical emergency. For suicidal thoughts or an emotional crisis, call or text 988 to reach the Suicide and Crisis Lifeline. For a non-emergency conversation, Psychology.com has a therapist directory. These routes serve different needs; a crisis line does not replace emergency medical services.
How we compiled this
Figures come from federal reports, national survey publications and original research. SAMHSA citations link to the agency’s official annual report pages. Data years, age groups and diagnostic definitions are retained; overlapping substance categories are never added together. Final mortality totals are distinguished from provisional estimates and rolling annual periods. Historical studies supply context where their definitions remain useful, with their dates stated explicitly. Recovery research, gambling indicators and substance-use prevalence are kept separate from diagnosed disorder estimates. Percentages describe the populations named beside them, and observational findings do not establish causation. Source text and short verification quotes are retained in the accompanying research bank. Publisher sources were fetched again on September 16, 2026. Search located the 2025 NSDUH release and 2025 Monitoring the Future findings, but their report pages could not be fetched successfully in this pass; the corresponding 2024 figures therefore retain their explicit dates. Medication comparisons by age and sex use adults who both needed and received OUD treatment as their denominator. Last full review: September 16, 2026.
Journalists and researchers may reuse any statistic with attribution to the original source and a link to Psychology.com.
Cite this source
Fontane Pennock, S. (2026, September 13). Addiction Statistics 2026. Psychology.com. https://psychology.com/addiction-statistics/
References
- Substance Abuse and Mental Health Services Administration. (2025). Key substance use and mental health indicators in the United States: Results from the 2024 National Survey on Drug Use and Health. SAMHSA annual national report.
- Substance Abuse and Mental Health Services Administration. (2024). Key substance use and mental health indicators in the United States: Results from the 2023 National Survey on Drug Use and Health. SAMHSA annual national report.
- National Institute on Alcohol Abuse and Alcoholism. (2025). Alcohol use disorder in the United States: Age groups and demographic characteristics. 2024 NSDUH data. NIAAA.
- National Institute on Alcohol Abuse and Alcoholism. (2025). Alcohol use in the United States: Age groups and demographic characteristics. 2024 NSDUH data. NIAAA.
- National Institute on Alcohol Abuse and Alcoholism. (2026). Alcohol treatment in the United States. 2024 NSDUH data. NIAAA.
- National Institute on Alcohol Abuse and Alcoholism. (2026). Economic burden of alcohol misuse in the United States. NIAAA.
- Garnett, M. F., & Miniño, A. M. (2026). Drug overdose deaths in the United States, 2023 to 2024. NCHS Data Brief No. 549. CDC NCHS.
- National Center for Health Statistics. (May 13, 2026). U.S. overdose deaths decrease for third consecutive year in 2025. CDC release.
- Centers for Disease Control and Prevention. (August 31, 2026). CDC launches new overdose prevention data channel. CDC release.
- National Institute on Drug Abuse. (2024). Drug overdose deaths: Facts and figures. National mortality data through 2023. NIDA.
- Esser, M. B., Sherk, A., Liu, Y., & Naimi, T. S. (2024). Deaths from excessive alcohol use: United States, 2016 to 2021. MMWR, 73, 154-161. CDC MMWR.
- National Institute on Drug Abuse. (December 17, 2024). Reported use of most drugs among adolescents remained low in 2024. Monitoring the Future survey. NIDA.
- Jamal, A., et al. (2024). Tobacco product use among middle and high school students: National Youth Tobacco Survey, United States, 2024. MMWR, 73, 917-924. CDC MMWR.
- Centers for Disease Control and Prevention. (2024). Youth Risk Behavior Survey data summary and trends report: 2013 to 2023. CDC report PDF.
- National Council on Problem Gambling. (n.d.). National Survey on Gambling Attitudes and Gambling Experiences 3.0: 2024 findings and methodology. NCPG.
- Hasin, D. S., et al. (2015). Prevalence of marijuana use disorders in the United States between 2001 to 2002 and 2012 to 2013. JAMA Psychiatry, 72, 1235-1242. NCBI abstract.
- Kelly, J. F., Bergman, B., Hoeppner, B. B., Vilsaint, C. L., & White, W. L. (2017). Prevalence and pathways of recovery from drug and alcohol problems in the United States population. Drug and Alcohol Dependence, 181, 162-169. PMC full text.
- Dowell, D., et al. (2024). Treatment for opioid use disorder: Population estimates, United States, 2022. MMWR, 73, 567-574. CDC MMWR.
- Centers for Disease Control and Prevention. (n.d.). Naloxone dispensing rate maps. Retail pharmacy data, 2019 to 2024. CDC.
- Maruschak, L. M., Bronson, J., & Alper, M. (2021). Alcohol and drug use and treatment reported by prisoners: Survey of Prison Inmates, 2016. NCJ 252641. Bureau of Justice Statistics. BJS report PDF.
- Office of the Surgeon General. (2016). Facing addiction in America: The Surgeon General’s report on alcohol, drugs, and health. Chapter 1, Introduction and overview of the report. NCBI Bookshelf.
- World Health Organization. (June 28, 2024). Alcohol: Fact sheet. Alcohol use disorders, dependence and alcohol-attributable deaths for 2019. WHO.
- National Institute on Alcohol Abuse and Alcoholism. (2025). Alcohol use disorder in the United States: Youth ages 12 to 17 and adults ages 18 and older, 2024 NSDUH estimates. Age-specific source figures.
- Dowell, D., et al. (June 27, 2024). Treatment for opioid use disorder: Population estimates, United States, 2022. Age and sex comparisons among adults needing and receiving treatment. CDC publisher report.
More statistics and related pages
Talk it through with a licensed therapist
If substance use or its effects on your relationships feel close to home, the therapist directory offers a place to explore professional support and find someone to talk with.
This page is educational information, not a diagnosis or a substitute for professional care. If you are in crisis, call or text 988 (U.S. Suicide & Crisis Lifeline), any time.