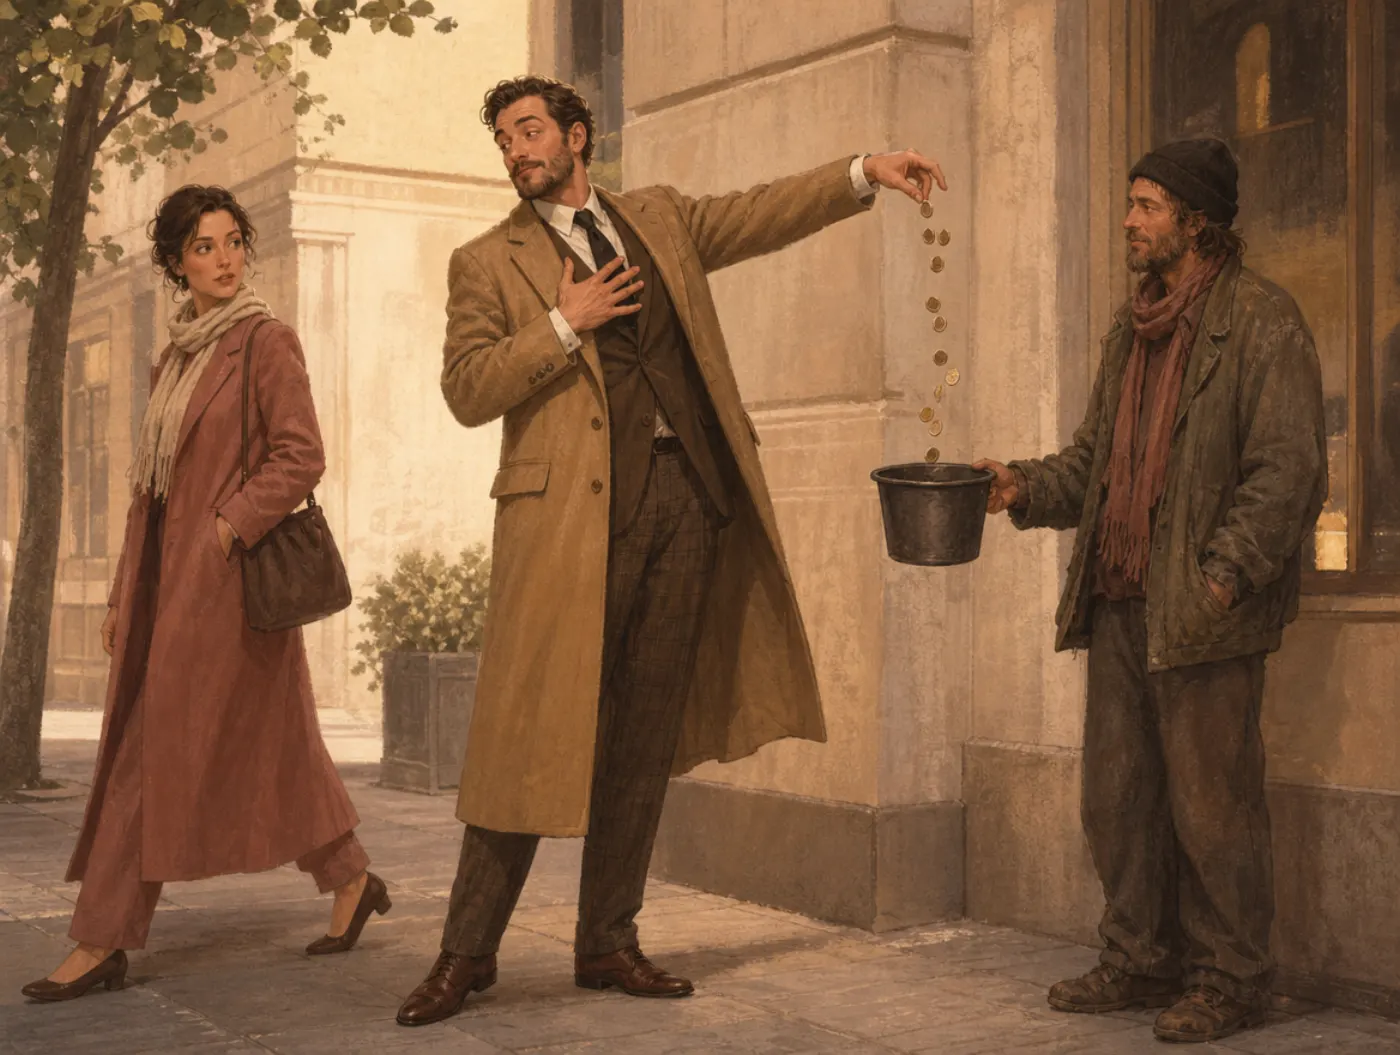
In short
Social desirability bias is the tendency to give the answer that looks good rather than the answer that is true, raising reports of approved behavior and lowering reports of behavior that would be judged. It shows up in survey data on voting, charity, exercise, drinking, driving and religious attendance, in customer feedback, in employee engagement scores and in job interviews.
How social desirability bias works
Answering a question about yourself involves two jobs: working out the answer, and deciding what to say. The second job takes account of who is listening. If the honest answer would make you look careless, selfish, unhealthy or unkind, the reported answer drifts toward the version that would not, and the drift is largest where the subject is sensitive and the audience is closest.
Delroy Paulhus distinguished two parts of this in 1984. Impression management is the deliberate part: editing an answer for an audience. Self-deceptive enhancement is the part the person is not aware of, an honestly held but inflated view of themselves. The practical consequence is that the two respond to different things. Anonymity and self-administration can reduce impression management, because they remove the audience; they do nothing about a belief the person actually holds.
Roger Tourangeau and Ting Yan reviewed the survey evidence in 2007 and reached a conclusion that matters for anyone reading self-reported numbers: misreporting on sensitive topics is common and largely situational. It depends on whether the respondent has anything embarrassing to report, on whether an interviewer is present, on how the question is worded, and on who else might see the answer. It is better described as editing than as a personality trait.
The size of the editing can be measured against records. Hadaway, Marler and Chaves compared what Americans told pollsters about church attendance in 1993 with attendance counted in sampled congregations and dioceses, and estimated real attendance at about half the self-reported level. The same gap appears wherever a validated record exists: reported voting exceeds verified turnout, reported exercise exceeds measured activity, reported drinking falls short of alcohol sales.
A longstanding instrument in this area, the Marlowe-Crowne scale, is also a caution. Crowne and Marlowe built it in 1960 from 33 true-false statements, 18 of them unlikely virtues to claim and 15 of them common faults to deny, intending to measure the need to answer in culturally sanctioned ways. A high score was long treated as a warning that the rest of a questionnaire was inflated. The problem is that the need to be approved of is itself a stable trait, so a high score can be an accurate self-description rather than evidence of distortion, which is one reason survey methodologists have moved toward changing the procedure rather than scoring the respondent.
The original study
Douglas Crowne and David Marlowe published "A new scale of social desirability independent of psychopathology" in the Journal of Consulting Psychology in 1960. Earlier measures of faking good had been drawn from clinical inventories, so a high score could mean distortion or could mean genuine distress. Crowne and Marlowe assembled statements with no clinical content, some describing approved behaviors that are unlikely to be true of anyone and others describing disapproved behaviors that are true of almost everyone, and had judges rate their desirability. The 33 items that survived became the scale that is still in use: 18 keyed true, so that agreeing claims an improbable virtue, and 15 keyed false, so that disagreeing denies an ordinary fault.
The experimental work that the demo on this page follows came later and changed the method rather than scoring the person. Roger Tourangeau and Tom Smith reported it in Public Opinion Quarterly in 1996. Working with an area probability sample of adults in Cook County, Illinois, they assigned respondents at random to one of three modes: an interviewer asking the questions and entering the answers, the respondent reading the questions on a laptop and entering their own answers, or the respondent hearing the questions through headphones and answering on the laptop. The questions covered sexual behavior and illicit drug use. The procedures were otherwise identical, and about 365 interviews were completed in the first wave.
Self-administration raised the reports. Compared with the interviewer condition, respondents who answered through headphones on the laptop were 1.48 times as likely to report ever using marijuana and 1.81 times as likely to report ever using cocaine, with similar ratios across shorter reporting periods. The difference between the two self-administered modes was not significant for any of the drug variables, which points at the interviewer rather than at the computer.
The same study showed that wording does its own work: when the answer options for a question about numbers of sexual partners emphasized the low end of the range, respondents reported fewer partners than when the options emphasized the high end. Nothing about the respondents differed between conditions. What differed was who would hear the answer, and what the form made easy to say.
Everyday examples
The bias runs wherever a number comes from someone describing themselves. The rows below are illustrations, not findings from the studies cited here.
| Situation | What the bias does | What helps |
|---|---|---|
| An employee engagement survey run by the manager's team | Scores come back high, and the problems arrive later through other channels | Use a third party, report only aggregates above a minimum group size, and say so on the form |
| A clinician asking about drinking or medication adherence | Reports move toward the answer that avoids a lecture, which skews the record | Ask with forgiving wording and a longer time frame, and use self-administered forms where possible |
| Exit polls and pre-election surveys | Intentions that feel unpopular are understated, and claimed turnout exceeds verified turnout | Compare against validated records, and read house effects and mode differences alongside the number |
| A job interview question about weaknesses | The answer is a performance by both parties, and tells you little about the work | Use work samples and structured questions about specific past situations |
| Self-reported exercise, sleep or screen time | Reported figures sit well above or below what devices record | Measure one week directly before setting any target from the self-report |
How to counter it
Because the bias is produced by the situation, the counters are changes to the situation rather than appeals to honesty.
- Remove the audience. Answers entered by the respondent rather than given to an interviewer raised reports of sensitive behavior by about half again in the 1996 experiment's audio condition, and the two self-administered modes did not differ significantly, which locates the effect in the presence of an interviewer.
- Say what happens to the data, in specifics. Who sees it, at what level of aggregation, for how long. A general promise of confidentiality is weaker than a described procedure.
- Word the question so the awkward answer is easy. A longer reference period, a forgiving preamble and response options that do not make the honest answer the extreme one all help.
- Ask about behavior, not about virtue. What someone did last Tuesday is harder to dress up than what they usually do.
- Validate against something. Records, device data, sales figures or a known base rate turn a self-report into a measurement with an error bar.
- When you read a survey, ask who collected it and how. Mode, sponsor and wording change the number, sometimes by more than the effect being reported.
What it is not
Social desirability bias is mostly about the answer that gets reported. Its neighbors are about the belief behind the answer and about behavior under observation.
- It is not the same as illusory superiority, the sincere belief that you are above average on desirable traits, though the two meet. Paulhus's model puts a sincerely held flattering self-view under self-deceptive enhancement, one of the two components of socially desirable responding. What this page is mostly about is the other component, impression management: the editing done for an audience, which anonymity can reduce while a genuinely held belief stays where it is.
- It is not the self-serving bias, which credits yourself for successes and blames circumstances for failures. That shapes the explanation; social desirability shapes the disclosure.
- It is not the observer effect, where being watched changes the behavior itself. Here the behavior has already happened and what changes is the account of it.
- It is not lying, though it includes some. Most of the effect is editing at the margin: a rounded number, a vaguer answer, the omission of a detail nobody asked twice about.
Tests and tools that use this
Related biases
Social Desirability Bias FAQ
What is social desirability bias?
It is the tendency to answer questions about yourself in the way that looks good rather than the way that is accurate, which inflates reports of approved behavior and deflates reports of behavior that would be judged. It affects survey data on voting, charity, exercise, drinking and religious attendance, and it is strongest when the topic is sensitive and someone is listening.
What is an example of social desirability bias?
Church attendance in the United States is the clearest case with a check against it. Hadaway, Marler and Chaves compared what people told pollsters in 1993 with attendance counted in sampled congregations and dioceses, and estimated the real figure at about half the reported one. Reported voter turnout likewise exceeds verified turnout, and reported exercise exceeds what devices measure.
How does the demo on this page work?
The page assigns you one of two versions using a value kept only in your browser's session storage, so a reload shows the same one. Both ask the same question about overstating experience on a job application; one asks you to imagine answering out loud with your name recorded, the other to imagine an unmarked card in a sealed box. Once each version has 50 or more responses, the result screen shows both splits side by side.
What is the Marlowe-Crowne Social Desirability Scale?
It is a 33-item true-false questionnaire published by Crowne and Marlowe in 1960, and intended to measure the need to answer in culturally sanctioned ways. Eighteen items ask the respondent to endorse an unlikely virtue and 15 to deny a common fault, so a high score comes from doing both. It was designed to be free of clinical content, unlike earlier faking-good measures. High scores are often read as a warning that other answers are inflated, which assumes the scale measures distortion rather than a genuine need for approval.
How do researchers reduce social desirability bias?
Mainly by changing the procedure. Letting respondents enter answers themselves, on a computer or on paper, raises reports of sensitive behavior substantially, and the gain comes from removing the interviewer rather than from the technology. Other measures include stating exactly what happens to the data, wording questions so the awkward answer is easy to give, asking about specific recent behavior, and validating self-reports against records.
Does anonymity remove social desirability bias?
It removes part of it. Paulhus's two-component model separates impression management, the editing done for an audience, from self-deceptive enhancement, an honestly held but flattering view of oneself. Anonymity acts on the first and not the second, which is why anonymous surveys still show people reporting themselves as better than average drivers, employees and partners.

References
- Crowne, D. P., & Marlowe, D. (1960). A new scale of social desirability independent of psychopathology. Journal of Consulting Psychology, 24(4), 349-354. doi.org
- Paulhus, D. L. (1984). Two-component models of socially desirable responding. Journal of Personality and Social Psychology, 46(3), 598-609. doi.org
- Tourangeau, R., & Smith, T. W. (1996). Asking sensitive questions: The impact of data collection mode, question format, and question context. Public Opinion Quarterly, 60(2), 275-304. doi.org
- Tourangeau, R., & Yan, T. (2007). Sensitive questions in surveys. Psychological Bulletin, 133(5), 859-883. doi.org
- Hadaway, C. K., Marler, P. L., & Chaves, M. (1993). What the polls don't show: A closer look at U.S. church attendance. American Sociological Review, 58(6), 741-752. doi.org
Cite this source
Psychology.com. (2026, October 21). Social Desirability Bias. Psychology.com. https://psychology.com/biases/social-desirability-bias