In short
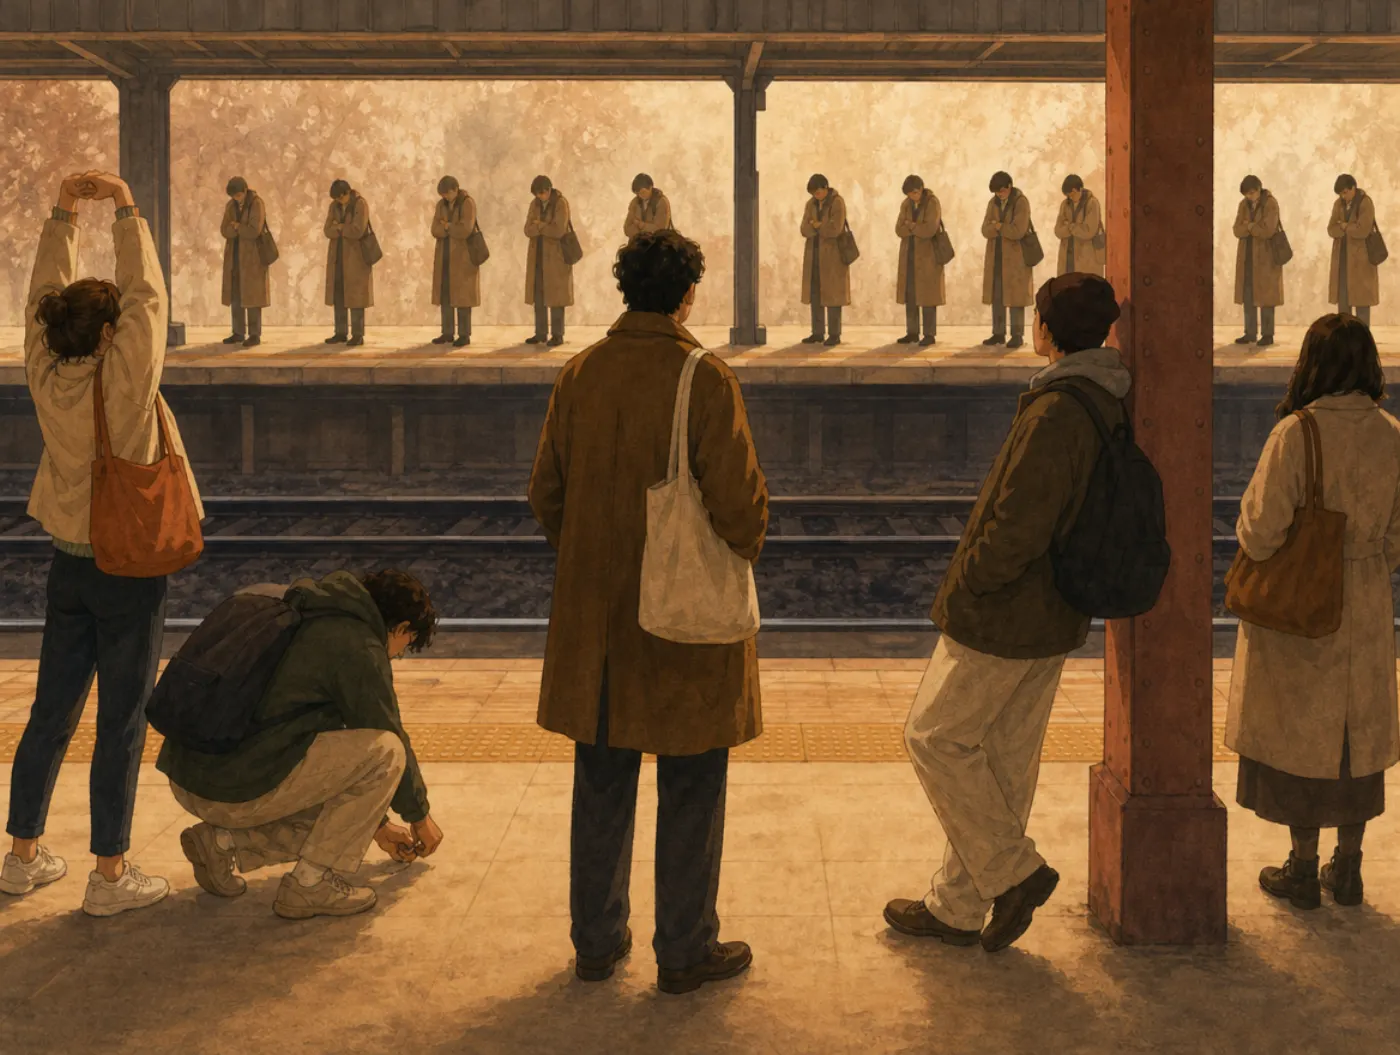
Out-group homogeneity bias is the tendency to see members of a group you do not belong to as more alike each other than members of your own group, so that one person's choice seems to speak for all of them. It shows up in talk about generations, nationalities, professions and political sides, and it is one of the conditions that makes a stereotype feel like a safe prediction.
How out-group homogeneity bias works
The simplest account is a sampling problem. You meet people from your own group constantly and in many different situations: at work, tired, celebrating, arguing, ill. You meet people from other groups less often and in fewer settings, usually one setting. The sample you hold of your own group is wide enough to contain contradictions; the sample you hold of the other group is narrow enough to look consistent. Each sample feels like the group it came from.
Bernadette Park and Myron Rothbart added a second mechanism in 1982, which they called levels of social categorization. When you encode something about an in-group member, you file it under the person. When you encode something about an out-group member, you file it under the group. Months later you remember that a colleague from your own department dislikes meetings, and that people in the other department dislike meetings. Nothing about either memory felt like a judgment at the time, but one of them has a name attached and the other does not.
Two features of the effect rule out the easy explanation that it is just dislike. It is symmetric: both sides of a pair of groups show it about each other, which Park and Rothbart demonstrated for men and women and for three neighboring sororities. And it appears for favorable traits as much as unfavorable ones, so it is not a way of running the other group down. As the authors put it, the perception that members of another group all look alike does not require any wish to disparage them.
The effect is not universal, and the exceptions are informative. Bernd Simon and Rupert Brown reported in 1987 that members of small minority groups sometimes see their own group as the more homogeneous one, which fits a different mechanism: a group whose identity is under pressure gains something from looking united. Thomas Ostrom and Constantine Sedikides concluded in 1992, reviewing the literature, that the effect is reliable for real groups but weak or absent for groups created in the laboratory with no history behind them. What travels is the pattern for groups people actually belong to.
The original study
Park and Rothbart's "Perception of out-group homogeneity and levels of social categorization" appeared in the Journal of Personality and Social Psychology in 1982 and reported four experiments. The first asked 74 men and 74 women to estimate the proportion of either men or women who would endorse each of 54 personality and attitude statements, pretested so that both sexes agreed on how masculine, feminine, favorable or unfavorable each one was. Judges rating their own sex estimated the stereotype-consistent statements as less widespread, and the stereotype-inconsistent statements as more widespread, than judges rating the other sex did. In other words, both groups described their own sex as the more mixed one.
The third experiment used groups small enough to know personally. Ninety women from three sororities at the University of Oregon, chosen because they lived close together and mixed socially, rated how characteristic each of ten attributes was for each of the three houses, and then rated how similar the members of each house were to one another on a 9-point scale. Analyzed as standardized scores, every sorority rated itself as less alike than the other two rated it: the clearest case placed its own members at -0.98 while the other two houses placed that same group at -0.09 and 0.00.
Read the diagram and evidence as text
The same varied face array appears above both comparisons. Insiders’ perceived array preserves the individual face shapes; outsiders’ perceived array repeats a single shape. This is a schematic direction, not literal identical perception. Standardized similarity scores are labels only: −0.98 from the group’s own members and −0.09 and 0.00 from the other houses.
One sorority, rated by insiders and by outsiders
Standardized similarity scores as labels; lower means less alike. 90 women, three houses. No bars
The same sorority's members; only the rater's own group changes
Rated by its own members: Similarity -0.98: seen as varied individuals
Rated by the other two sororities: Similarity -0.09 and 0.00: seen as more alike
| Condition | Value and unit | Evidence quote |
|---|---|---|
| Members of three sororities | 90 women rating | 90 women rated how alike the members of each of three sororities were |
| One sorority rated by its own members | -0.98 standardized similarity score | the members of one sorority placed their own group at -0.98 on the standardized similarity scale |
| That same sorority rated by a second house | -0.09 standardized similarity score | members of the other two placed that same group at -0.09 and 0.00 |
| That same sorority rated by the third house | 0.00 standardized similarity score | members of the other two placed that same group at -0.09 and 0.00 |
George Quattrone and Edward Jones had made the point about prediction two years earlier, in 1980. Students at Princeton and Rutgers watched a student from one university or the other make a choice, then estimated what proportion of that university's students would choose the same way. The generalization from a single person was stronger when the person belonged to the other university, and it was strongest for the choice where the participants had the fewest preconceptions to fall back on.
Patricia Linville, Gregory Fischer and Peter Salovey extended the finding to age in 1989, with college-age and elderly participants judging the variability of both age groups. Each group perceived the other as the less variable one, and the authors linked the difference to familiarity: the more individual members of a group a person knows, the more varied the group looks. Their paper reports distributional measures rather than simple percentages, so this page gives the direction of their result and no figures from it.
Everyday examples
The bias is visible wherever one member of a group is treated as a sample of the whole. The rows below are illustrations, not findings from the studies cited on this page.

| Situation | What the bias does | What helps |
|---|---|---|
| One rude tourist from another country | The behavior is filed under the nationality rather than the person | Ask whether you would file the same behavior from a compatriot under your own nationality |
| Talk about "what young people want" at work | A whole age band is given one set of preferences, usually from two or three examples | Ask for the spread in the survey data, not the average, and name three people in the group who disagree |
| Political argument about the other side | Opponents are treated as a single position, so a counter-example is read as a rare exception | Find the internal disagreements in the other group; every large group has them |
| Hiring from an unfamiliar profession | Candidates from that field are judged by one previous hire from it | Score each candidate on the same work sample, and count how many you have actually met |
| Recognizing faces of a group you rarely see | Individuating details are not encoded, so the faces are harder to tell apart | Treat your own recognition as unreliable here, especially where identification matters |
How to counter it
The repair is to get more individuals into the sample and to ask for spread rather than averages.
- Ask for the distribution. "What share of them hold that view" is answerable; "what they think" is not. Where survey data exist, read the spread and not only the majority.
- Name three members who disagree with one another. If you cannot, you do not know the group well enough to generalize about it, which is a fact about your sample rather than about them.
- Count your contacts. The sampling account predicts that the group you know two people from will look the most uniform, so notice which groups those are.
- Watch the filing. When you learn something about a person from another group, attach it to the person by name. That is what you do automatically for your own group.
- Remember it runs both ways. The group you find uniform finds your group uniform, for the same reason and with the same confidence.
- Be careful where the stakes are high. Identification from memory, hiring and discipline are exactly the places where treating one person as a sample of a group does measurable harm.
What it is not
Three related effects involve groups, and they differ in what is being claimed about them.
- It is not stereotyping, which is the content of a belief about a group. Out-group homogeneity is about the variance rather than the content: it is the belief that there is little spread to be found, which is what makes a stereotype feel like a safe bet about any individual.
- It is not in-group favoritism, the tendency to treat your own group better. Park and Rothbart found out-group homogeneity for favorable attributes as well as unfavorable ones, and no evidence that it depended on preferring one's own group.
- It is not the cross-race effect, the difficulty people have recognizing faces of a group they see rarely. That is a memory finding about faces; out-group homogeneity is a judgment about how varied a group's members are, and the two are usually explained by the same shortage of individuating contact.
Tests and tools that use this
Related biases
Out-Group Homogeneity Bias FAQ
What is out-group homogeneity bias?
It is the tendency to see another group's members as more alike one another than your own group's members are. Park and Rothbart demonstrated it in 1982 for men and women and for three neighboring sororities: each group rated its own members as more varied than the other groups rated those same members, so every group looked more uniform from the outside than from within.
How did the demo on this page work?
Six questions asked what share of a group would make the same choice as one member: three about your own age group and three about the age group furthest from yours, same choices in both. The page compared your average for the other group with your average for your own. A higher average for the other group is the pattern Quattrone and Jones found: one member's choice taken as a stronger sign of what the group would do when the group is not yours. Equal averages do not count.
Why do other groups seem more uniform?
Mostly because you have a smaller and narrower sample of them. You see your own group in many situations and other groups in few, so your own group's contradictions are visible and theirs are not. Park and Rothbart added a second reason: information about an out-group member tends to be filed under the group, while information about an in-group member is filed under the person.
Is it the same as prejudice?
No. It is a judgment about how varied a group is, not a hostile attitude toward it, and it appears for flattering attributes as well as unflattering ones. It does make prejudice easier, because a group with no perceived spread can be summarized by a stereotype and any individual can be predicted from it. The two are studied separately and can occur without each other.
Does every group show it?
No. Simon and Brown reported in 1987 that members of small minority groups sometimes see their own group as the more homogeneous one, which fits the value a group under pressure gets from looking united. Ostrom and Sedikides concluded in 1992 that the effect is reliable for real groups and weak or absent for groups invented in the laboratory with no history behind them.
What reduces it?
Contact with more individual members, and asking for spread rather than averages. The familiarity account that Linville, Fischer and Salovey put forward in 1989 predicts that the more members of a group you know as individuals, the more varied the group looks. Short of that, ask what share of the group holds a view and try to name three members of it who disagree with one another.

References
- Park, B., & Rothbart, M. (1982). Perception of out-group homogeneity and levels of social categorization: Memory for the subordinate attributes of in-group and out-group members. Journal of Personality and Social Psychology, 42(6), 1051-1068. doi.org
- Quattrone, G. A., & Jones, E. E. (1980). The perception of variability within in-groups and out-groups: Implications for the law of small numbers. Journal of Personality and Social Psychology, 38(1), 141-152. doi.org
- Linville, P. W., Fischer, G. W., & Salovey, P. (1989). Perceived distributions of the characteristics of in-group and out-group members: Empirical evidence and a computer simulation. Journal of Personality and Social Psychology, 57(2), 165-188. doi.org
- Simon, B., & Brown, R. (1987). Perceived intragroup homogeneity in minority-majority contexts. Journal of Personality and Social Psychology, 53(4), 703-711. doi.org
- Ostrom, T. M., & Sedikides, C. (1992). Out-group homogeneity effects in natural and minimal groups. Psychological Bulletin, 112(3), 536-552. doi.org
Cite this source
Psychology.com. (2026, October 22). Out-Group Homogeneity Bias. Psychology.com. https://psychology.com/biases/out-group-homogeneity-bias