
In short
The Peltzman effect is the claim that a safety measure is partly or wholly offset because people respond to feeling safer by taking more risk, so the benefit shows up smaller than the engineering predicted. It is named after the economist Sam Peltzman, whose 1975 study of US car safety regulation argued that the offset was close to complete, a strong version that later data did not support.
How the Peltzman effect works
The argument starts from an assumption about people rather than about cars. Treat risk as something a driver chooses rather than something that happens to them: speed, following distance and attention are all adjustable, and each adjustment buys time or convenience at the price of danger. Make the car safer and the price of driving fast has fallen, so a driver who was content with their old level of danger can take some of the gain in speed instead of in safety. That is Sam Peltzman's mechanism, and it is a straightforward piece of economics rather than a quirk of psychology.
The strong form of the idea goes further. Gerald Wilde's risk homeostasis theory, from the 1980s, proposed that people hold a target level of risk and adjust until they reach it, which would mean that safety measures can never reduce harm on average. That version has not held up: the seat belt evidence below shows a real reduction in deaths that behavior did not claw back.
The reason the debate ran for decades is that the offsetting behavior is hard to see. Deaths are counted carefully, but following distances and attention are not, so researchers test the theory indirectly by watching the people who get no protection from the device. If belted drivers really drive worse, deaths among pedestrians, cyclists and motorcyclists should rise with belt use. Cohen and Einav ran exactly that test on 15 years of state data, and the estimate came out statistically indistinguishable from zero, which is the main evidence against the complete offset.
So the honest summary has two parts. Behavioral adaptation to safety equipment is real and has been observed directly, as with the Oslo taxi drivers who followed more closely in cars with antilock brakes. The claim that adaptation cancels the benefit is not supported, and the version of the Peltzman effect that circulates as an argument against safety rules is the version the data rejected. Using it that way is the most common error on this topic.
The original study
Sam Peltzman published "The effects of automobile safety regulation" in the Journal of Political Economy in 1975. The subject was the federal standards that began to apply to US cars from the 1966 model year: seat belts, padded instrument panels, dual braking systems and energy-absorbing steering columns. Engineering studies of those devices implied that annual highway deaths would have been about 20 percent higher without them.
Peltzman's objection was that those studies hold driver behavior fixed. He modeled the demand for driving intensity, estimated the relationships from time-series and cross-section data on fatality rates, and concluded that the offsets from non-regulatory demand for safety and from driver response were "virtually complete," so that the regulation had not reduced highway deaths. His time-series estimates, though not his cross-section ones, suggested that occupant lives were being saved at the cost of more deaths among pedestrians and cyclists and more nonfatal accidents, which is the pattern his model predicted.
The strong conclusion was contested almost at once. Leon Robertson's 1977 critique in the Journal of Economic Issues reported errors in the data and argued that Peltzman's model failed to reproduce fatality rates from before the regulation, and that evidence he had passed over showed the standards reducing deaths.
The best-identified test came in 2003, when Alma Cohen and Liran Einav published "The effects of mandatory seat belt laws on driving behavior and traffic fatalities" in The Review of Economics and Statistics. Their panel covered all 50 states and the District of Columbia from 1983 to 1997, with measured belt usage rather than law dummies alone, and they instrumented usage with the laws and their enforcement type to deal with the fact that cautious drivers buckle up more. Laws with secondary enforcement raised usage by about 11 percentage points and laws with primary enforcement by about 22. A 1-percentage-point rise in usage was associated with about 136 fewer deaths a year, an effect less than half the size the National Highway Traffic Safety Administration was using at the time. Usage had no statistically significant effect on deaths among people outside cars, which is the compensating-behavior prediction, and the result held when the test was narrowed to pedestrians.
Read the diagram and evidence as text
A belted person feeds a solid branch to observed protection and a dashed branch to a proposed speed-gauge increase. The panel estimate was about 136 fewer traffic deaths annually per 1-percentage-point rise in belt use. No statistically significant effect was found on deaths among unprotected road users. The dashed behavioral pathway is not confirmed.
What the panel measured, and what it did not find
Counts and points as labels, not bars. 50 states and DC, 1983 to 1997
Seat belt use rises: Each 1-point rise in use, measured across the panel rather than assumed
Measured: fewer deaths: About 136 fewer traffic deaths a year for every point of belt use
Measured: no change for the unprotected: No statistically significant effect on deaths among pedestrians, cyclists and motorcyclists, who get no protection from a belt
Proposed: part of the gain is spent: Peltzman's 1975 mechanism, that feeling safer makes risk cheaper. This study found no significant support for it
Complete offset: What the mechanism would produce if it ran to the end, and what the panel rejects
Seat belt use rises → protection saves lives → Measured: fewer deaths
Seat belt use rises → no spillover onto people a belt cannot protect → Measured: no change for the unprotected
Seat belt use rises → the step this study does not establish → Proposed: part of the gain is spent (error transition)
Proposed: part of the gain is spent → would have to hold for the benefit to vanish → Complete offset
| Condition | Value and unit | Evidence quote |
|---|---|---|
| Rise in seat belt use | 1 percentage point of seat belt use | a 1-percentage-point rise in seat belt use went with about 136 fewer traffic deaths a year |
| Per percentage point of seat belt use, all road users | 136 fewer traffic deaths a year | a 1-percentage-point rise in seat belt use went with about 136 fewer traffic deaths a year |
| Panel coverage | 50 states, plus the District of Columbia | panel of all 50 states and the District of Columbia from 1983 to 1997 |
| Panel start | 1983 year | panel of all 50 states and the District of Columbia from 1983 to 1997 |
| Panel end | 1997 year | panel of all 50 states and the District of Columbia from 1983 to 1997 |
Everyday examples
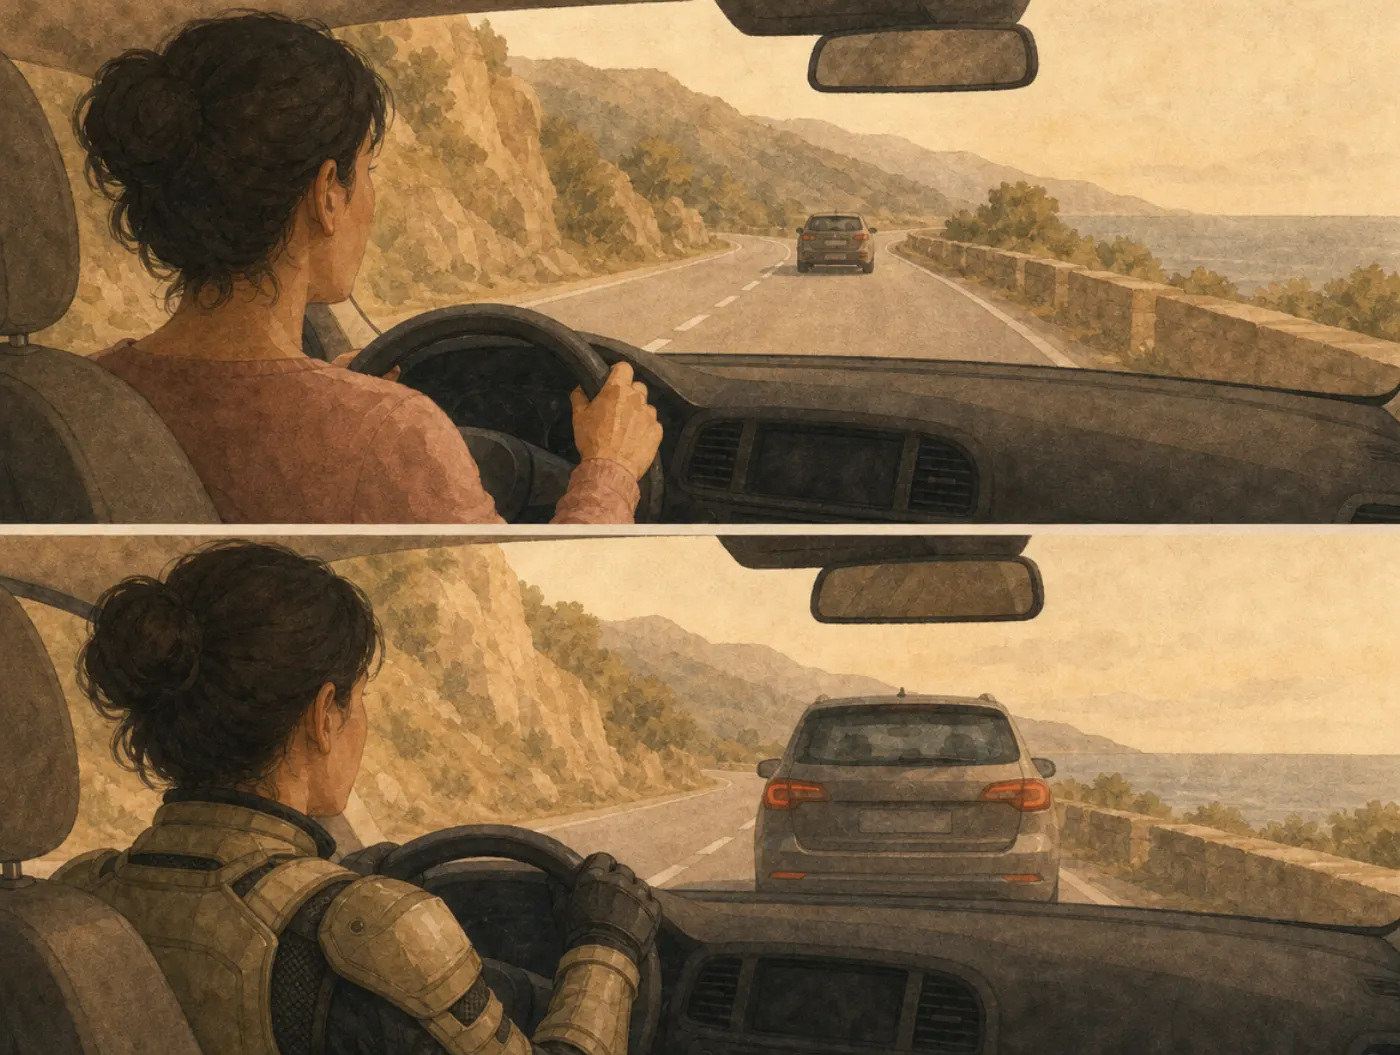
Risk compensation is worth looking for whenever a protection is added to an activity people control. The rows below are illustrations, not findings from the studies cited on this page.
| Situation | What the bias does | What helps |
|---|---|---|
| A new car with lane keeping and automatic braking | The driver trusts the system and attends to the road less, giving back part of the gain | Treat the system as a backstop for your mistakes, not as a reason to make more of them |
| Antilock brakes on a familiar route | Following distances shorten without the driver deciding to shorten them | Set a following distance by counting seconds, independently of what the car can do |
| A climbing harness or a safety line | The protected climber attempts moves they would not try unroped, which is partly the point and partly the risk | Decide the limit before the gear is on, and check the gear's actual failure modes |
| Sunscreen before a day outdoors | Protection is converted into extra hours in the sun rather than less exposure | Set the time in the sun first, then apply the sunscreen to that plan |
| A regulator approving a safety device | The projected benefit assumes behavior stays the same, which it may not | Evaluate with outcomes that include people the device does not protect, as the seat belt studies did |
How to counter it
The useful moves are about keeping the safety gain in the safety column instead of spending it.
- Name the behavior the device makes cheaper. A system that makes braking safer makes tailgating cheaper; once that is written down, it can be watched.
- Fix the limit before the equipment arrives. A following distance in seconds, a time in the sun, a maximum speed on a route: a rule set in advance is not renegotiated by the feeling of being protected.
- Count the people who are not protected. If a measure helps those inside and the harm moves outside, the total has not improved. This is the test that settled the seat belt argument.
- Do not treat partial adaptation as a reason to skip the protection. The measured adaptations are much smaller than the gains, so the device still wins.
- When you hear the Peltzman effect used to argue against a safety rule, ask for the number. The complete offset is the claim that failed; the size of any partial offset is an empirical question with an answer for each measure.
- For designers: avoid signaling the protection louder than the protection itself. A device that advertises invulnerability invites exactly the behavior that eats the benefit.
What it is not
The Peltzman effect sits inside a wider family of ideas about safety and behavior.
- It is not the same as risk compensation in general, which is the broad finding that people adjust behavior when their perceived risk changes. The Peltzman effect is the specific economic claim about safety regulation, and the specific strong version of it, a near-complete offset, is the part the evidence rejected.
- It is not zero-risk bias, the preference for eliminating one risk completely over reducing several by more in total. That is a choice between options; the Peltzman effect is about what happens after an option is in place.
- It is not the illusion of control, which is overestimating your influence over an outcome that is mostly chance. A driver who shortens a following distance because the brakes are better is responding to a real change in control, not an imagined one.
Tests and tools that use this
Related biases
Peltzman Effect FAQ
What is the Peltzman effect?
It is the claim that safety measures are offset by riskier behavior, named after the economist Sam Peltzman. His 1975 study of US car safety standards concluded that the offsets were virtually complete, so that the regulation had not reduced highway deaths. The general mechanism, usually called risk compensation, has support; the complete offset for seat belts does not.
Is the Peltzman effect real?
In its weak form, yes: people do adjust to feeling protected, and the adjustment has been observed directly. Sagberg, Fosser and Saetermo found in 1997 that Oslo taxi drivers with antilock brakes followed other cars more closely than those without, while airbags changed nothing measurable. In its strong form, that the adjustment cancels the benefit, no. Cohen and Einav found no significant rise in deaths among people outside cars as belt use rose.
How did the demo on this page work?
Three questions walked through what happened after US states made seat belts mandatory: deaths inside cars, deaths outside cars, and the general rule. Choosing the full-offset answer at any step counts as taking that story further than the evidence does. The reveal gives the figures from the 1983 to 1997 panel, and the demo scores the answers rather than measuring anything about the visitor.
Did seat belt laws save lives?
Yes, on the best-identified estimates. Cohen and Einav's panel of all 50 states and the District of Columbia found that a 1-percentage-point rise in belt use went with about 136 fewer traffic deaths a year, which implied roughly 1,500 to 3,000 lives a year if national use had risen from 68 percent to the 90 percent target. That is a substantial effect, and less than half the size the federal regulator was assuming.
What is the difference between the Peltzman effect and risk compensation?
Risk compensation is the general idea that behavior shifts when perceived risk changes, in any setting. The Peltzman effect is the version aimed at regulation: that mandated safety equipment produces offsetting behavior large enough to cancel the intended benefit. The first is a description of a mechanism; the second is a quantitative claim about an outcome, and that claim has been tested and not supported for seat belts.
Does this mean safety rules do not work?
No, and that is the most common misuse of the term. The measured adaptations are small next to the measured gains, and the offsetting harm that Peltzman's model predicted for people outside cars has not been found. What the literature does recommend is evaluating a safety measure with outcomes that include everyone affected, rather than assuming that behavior stays exactly as it was.

References
- Peltzman, S. (1975). The effects of automobile safety regulation. Journal of Political Economy, 83(4), 677-725. doi.org
- Cohen, A., & Einav, L. (2003). The effects of mandatory seat belt laws on driving behavior and traffic fatalities. The Review of Economics and Statistics, 85(4), 828-843. doi.org
- Robertson, L. S. (1977). A critical analysis of Peltzman's "The effects of automobile safety regulation." Journal of Economic Issues, 11(3), 587-600. doi.org
- Sagberg, F., Fosser, S., & Saetermo, I.-A. F. (1997). An investigation of behavioural adaptation to airbags and antilock brakes among taxi drivers. Accident Analysis and Prevention, 29(3), 293-302. doi.org
Cite this source
Psychology.com. (2026, October 22). Peltzman Effect. Psychology.com. https://psychology.com/biases/peltzman-effect